States with the most auto loan debt
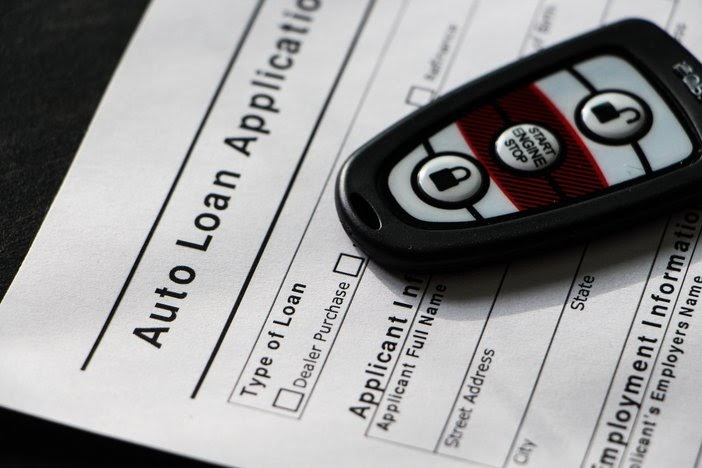
Photo Credit: Alamy Stock Photo
Perhaps no part of daily life changed as much by the COVID-19 pandemic as mobility—how often residents leave their homes and where they go. With stay-at-home orders in effect for large parts of last year, Americans upended their daily routines and, where possible, began working from home, increasing their reliance on delivery services, and avoiding public spaces, including public transportation.
Amid these changes, it wasn’t immediately clear how consumer spending and borrowing would be impacted, especially for cars and trucks. On the one hand, people weren’t traveling for pleasure or commuting to and from work; but on the other, individuals that previously relied on public transportation or rideshare increasingly sought to purchase their own vehicles.
Despite these changes, total auto loan debt continued to grow at the same pace in 2020 as in 2019, according to data from the Federal Reserve Bank of New York. In fact, auto loan debt hit a new record high of $1.37 trillion last year and now accounts for close to 10% of total household debt.
Fortunately for borrowers, auto lenders were generally as accommodating as credit card and mortgage lenders when granting pandemic forbearances, so the rate of delinquent auto loans, like delinquencies across other loan types, decreased in 2020 after rising for the past half decade.

One of the leading reasons for the years-long ascent of auto loan debt and delinquencies has been the steady rise of subprime lending beginning around 2010. Borrowers with the worst credit scores (less than 620) more than doubled the value of new loan originations between 2010 and 2015 to a level that remained relatively stable in the years preceding the pandemic.

USED CAR PRICES ARE THROUGH THE ROOF
Supply shortages mean once-in-a-lifetime opportunity to sell used cars for a profit. The average person using our lease buyout calculator learns that they’re sitting on over $3,700 in potential profit in their leased car - what’s your used car really worth?
Since the start of the pandemic, however, new dynamics have emerged. Subprime borrowers may still be struggling to make their car payments, but they’re not taking out new loans at the same levels. According to data from the New York Fed and Experian, new subprime loan originations dropped quickly in 2020, while borrowers with high credit scores—and also young borrowers—made up the difference. Generation Z consumers grew their auto debt by 12% while Millennials accumulated 6% more vehicle loan debt in 2020 than 2019.
Another factor that changed dramatically in the midst of the pandemic was used car prices. The Consumer Price Index for used vehicles had been steadily declining since the end of 2013 until July 2020, when it began to skyrocket. In just over a year, used car prices increased by 45%, including record spikes of 10% and 10.5% month-over-month in April and June 2021.

For borrowers struggling with their auto loan debt or lease payment, there likely hasn’t been a better time to sell a vehicle and cash in on the high used car prices. The average used car was worth about $5,000 more in July than in the spring, according to the CarGurus Index. The one catch for potential sellers? Record low inventory of both new and used vehicles means that finding a replacement won’t be easy.
To find out where borrowers are having the hardest time paying their auto loans, researchers at Copilot analyzed data from the New York Fed and Experian, then ranked states by the percentage of auto loans that were at least 90 days delinquent at the end of 2020. Researchers also reported the percentage of total household debt accounted for by auto loans, total auto loans per capita, and the average credit score in each state.
Here are the states with the most auto loan debt.
States With the Most Auto Loan Debt
Photo Credit: Alamy Stock Photo

15. Michigan
- Auto loan delinquency rate: 5.08%
- Auto loans as a share of total debt: 10.09%
- Total auto loan debt per capita: $4,150
- Average credit score: 714
TRADING IN A LEASE?
If the end of your lease is coming up, here’s what you need to know about trading in a lease. (The short answer? Don’t do it.)
Photo Credit: Alamy Stock Photo

14. West Virginia
- Auto loan delinquency rate: 5.10%
- Auto loans as a share of total debt: 17.45%
- Total auto loan debt per capita: $5,410
- Average credit score: 695
Photo Credit: Alamy Stock Photo

13. Delaware
- Auto loan delinquency rate: 5.17%
- Auto loans as a share of total debt: 9.18%
- Total auto loan debt per capita: $5,180
- Average credit score: 710
Photo Credit: Alamy Stock Photo

12. Arkansas
- Auto loan delinquency rate: 5.33%
- Auto loans as a share of total debt: 16.37%
- Total auto loan debt per capita: $5,760
- Average credit score: 690
Photo Credit: Alamy Stock Photo

11. Nevada
- Auto loan delinquency rate: 5.68%
- Auto loans as a share of total debt: 9.54%
- Total auto loan debt per capita: $5,450
- Average credit score: 695
Photo Credit: Alamy Stock Photo
10. Florida
- Auto loan delinquency rate: 5.69%
- Auto loans as a share of total debt: 11.36%
- Total auto loan debt per capita: $5,580
- Average credit score: 701
Photo Credit: Alamy Stock Photo

9. North Carolina
- Auto loan delinquency rate: 5.76%
- Auto loans as a share of total debt: 11.06%
- Total auto loan debt per capita: $5,360
- Average credit score: 703
Photo Credit: Alamy Stock Photo

8. Texas
- Auto loan delinquency rate: 5.82%
- Auto loans as a share of total debt: 14.94%
- Total auto loan debt per capita: $7,000
- Average credit score: 688
Photo Credit: Alamy Stock Photo

7. Oklahoma
- Auto loan delinquency rate: 5.83%
- Auto loans as a share of total debt: 14.60%
- Total auto loan debt per capita: $5,130
- Average credit score: 690
Photo Credit: Alamy Stock Photo

6. Georgia
- Auto loan delinquency rate: 6.08%
- Auto loans as a share of total debt: 11.24%
- Total auto loan debt per capita: $5,750
- Average credit score: 689
Photo Credit: Alamy Stock Photo

5. New Mexico
- Auto loan delinquency rate: 6.13%
- Auto loans as a share of total debt: 13.85%
- Total auto loan debt per capita: $5,790
- Average credit score: 694
Photo Credit: Alamy Stock Photo

4. Alabama
- Auto loan delinquency rate: 6.22%
- Auto loans as a share of total debt: 13.62%
- Total auto loan debt per capita: $5,330
- Average credit score: 686
Photo Credit: Alamy Stock Photo

3. South Carolina
- Auto loan delinquency rate: 6.29%
- Auto loans as a share of total debt: 10.93%
- Total auto loan debt per capita: $5,130
- Average credit score: 689
WHICH YEAR MODEL OF FORD ESCAPES TO AVOID
The ever-popular Ford Escape has some great year models and some not-so-great year models. Here’s the year models of Ford Escape to avoid buying used.
Photo Credit: Alamy Stock Photo

2. Louisiana
- Auto loan delinquency rate: 6.73%
- Auto loans as a share of total debt: 15.07%
- Total auto loan debt per capita: $6,150
- Average credit score: 684
Photo Credit: Alamy Stock Photo

1. Mississippi
- Auto loan delinquency rate: 7.26%
- Auto loans as a share of total debt: 16.03%
- Total auto loan debt per capita: $5,460
- Average credit score: 675
Detailed Findings & Methodology
The data used in this analysis is from the Federal Reserve Bank of New York’s Household Debt and Credit Report and Experian’s 2020 Consumer Credit Review. To determine the states with the most auto loan debt, researchers ranked states based on the auto loan delinquency rate, which is the percentage of balance 90+ days delinquent in quarter 4 of 2020. In the event of a tie, auto loans as a share of total debt was considered.