U.S. States Where People Are Spending the Most on Used vs. New Cars

Photo Credit: Dreamer Company / Shutterstock
One of the most significant economic stories of recent months has been the rapid growth in inflation. Recent Consumer Price Index data from the U.S. Bureau of Labor Statistics revealed that consumer prices had increased by 7.5% from January 2021 to January 2022. These figures continued a trend of historically unusual month-over-month and year-over-year price increases dating back to the spring of 2021.
Many economists attribute the current period of inflation to several factors related to the pandemic. One is robust government stimulus: through a series of relief efforts, the federal government has pumped money into the economy over the last two years to support businesses and households through interruptions from COVID-19. The relative strength of the economy has given households more money to spend, and this has helped boost consumer demand. In particular, consumers are spending more on physical products than on services. However, ongoing challenges with the global supply chain have made it difficult to manufacture and ship products amid this increased demand. With supply unable to keep up with demand, many categories are seeing prices rise.
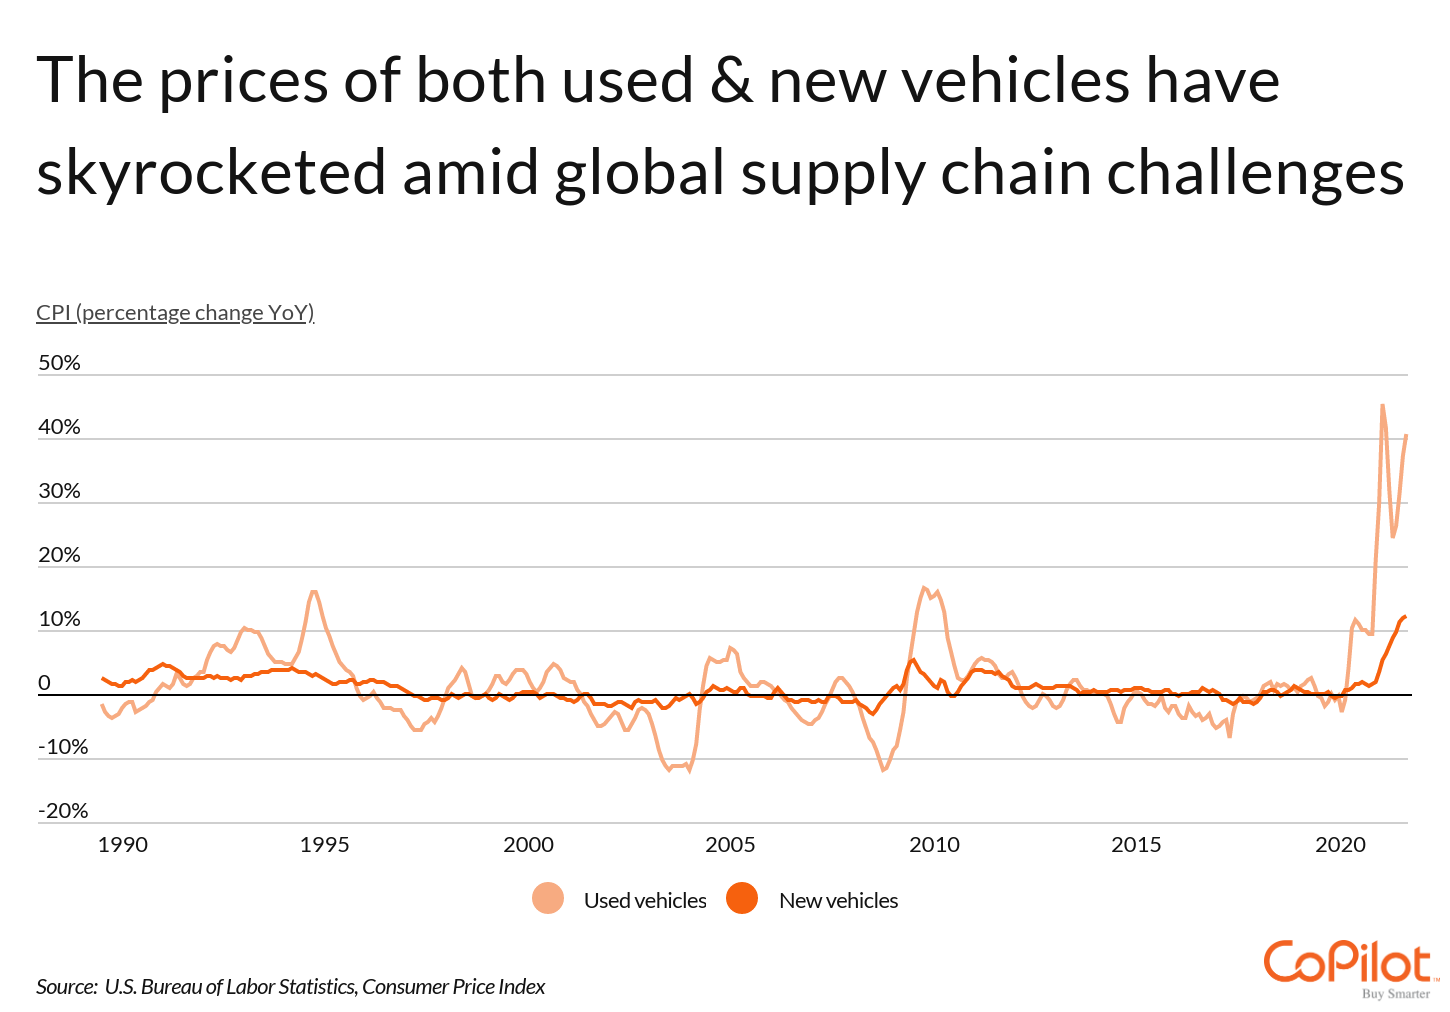
One of the categories where these dynamics have been felt most strongly is the market for new and used cars. Demand for vehicles has shifted sharply during the pandemic, dropping early in 2020 but recovering to near pre-pandemic levels since. However, shortages of semiconductor chips and other supply problems have made it difficult for car manufacturers to keep up with demand. This has meant that fewer new cars are coming on the market, which has increased the demand—and prices—for used vehicles. As a result, the Consumer Price Index for used vehicles was up more than 40% from January 2021 to January 2022, with prices for new vehicles up 12.2% over the same span.
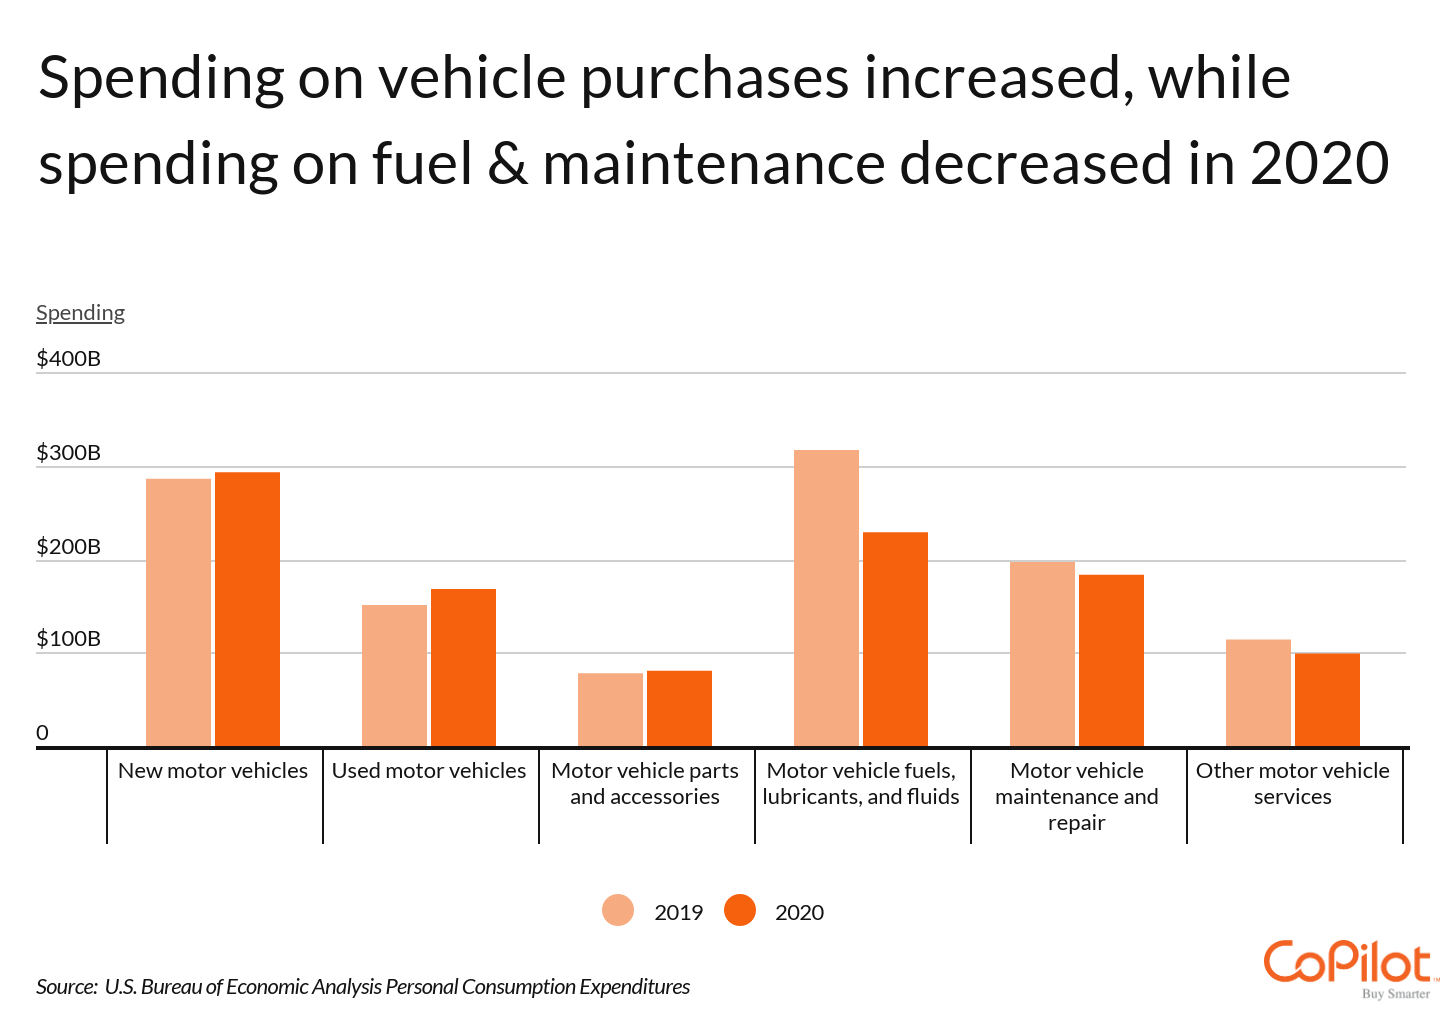
But spending on vehicles and related categories also shows how dynamics around supply, demand, and prices are shaking out differently by sector. While total spending on new and used motor vehicles increased from 2019 to 2020, other categories saw declines in total spending. Total spending on fuels, lubricants, and fluids dropped by more than 25%, and maintenance and repair and other services also saw slight declines. Differences in supply chains across these categories, reduced travel, and the aforementioned lower demand for services help explain why related expenses have not seen corresponding increases in spending as vehicle prices have increased.
RELATED
Is gap insurance worth it? In some cases, an insurance claim will pay out less than what your car is worth, and you end up owing money out-of-pocket to cover the difference. Gap insurance provides coverage in these situations—when your auto insurance falls short.
Spending in the new and used car market is also different based on geography. While the total annual dollar value spent on new vehicles exceeds that for used vehicles in every state, some states allocate far more towards used vehicles than average. Most of the states where used vehicles represent a larger portion of total vehicle purchases are found in the central U.S. In many of these states, at least 40% of vehicle sales (in dollars) are accounted for by the pre-owned market.
The data used in this analysis is from the U.S. Bureau of Economic Analysis 2020 Personal Consumption Expenditures. To identify the states spending the most on used vs. new cars, researchers at CoPilot calculated the percentage of all vehicle sales (in dollars) accounted for by used vehicle purchases. In the event of a tie, the state with the greater amount of used car spending per capita was ranked higher.
Here are the states where people are spending the most on used vs. new vehicles.
States Spending the Most on Used vs. New Vehicles
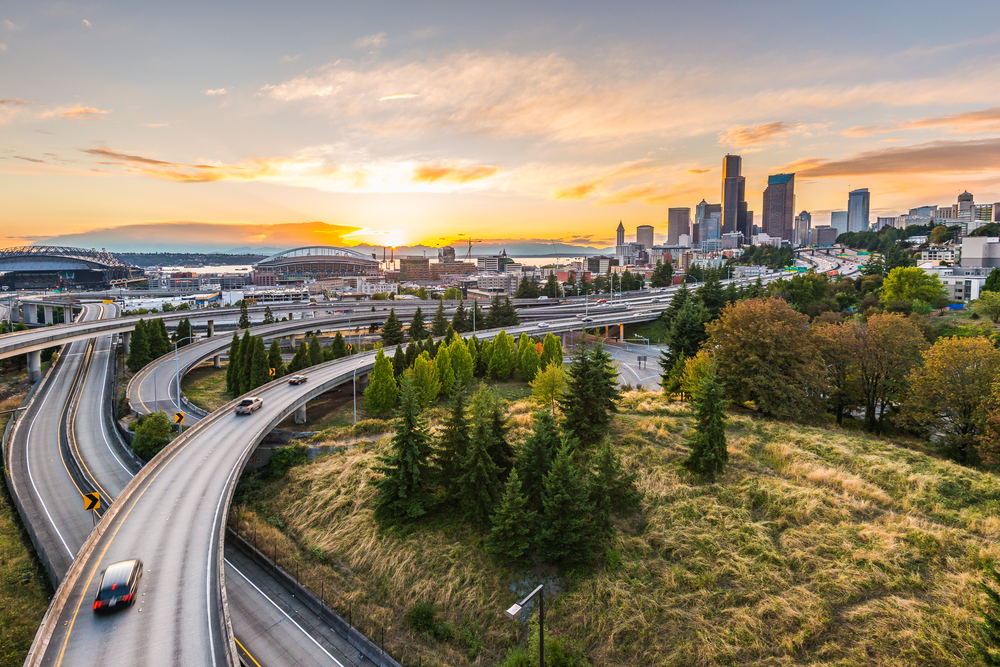
Photo Credit: Checubus / Shutterstock
15. Washington
- Used as a share of total vehicle purchase value: 41.42%
- Used vehicle spending per capita: $501
- Total used vehicle spending: $3,856,200,000
- Total new vehicle spending: $5,454,500,000
TRENDING
Used car prices are steep these days. Make sure you pull the trigger on your next used car purchase at just the right time with the help of CoPilot’s real-time used car price tracker.
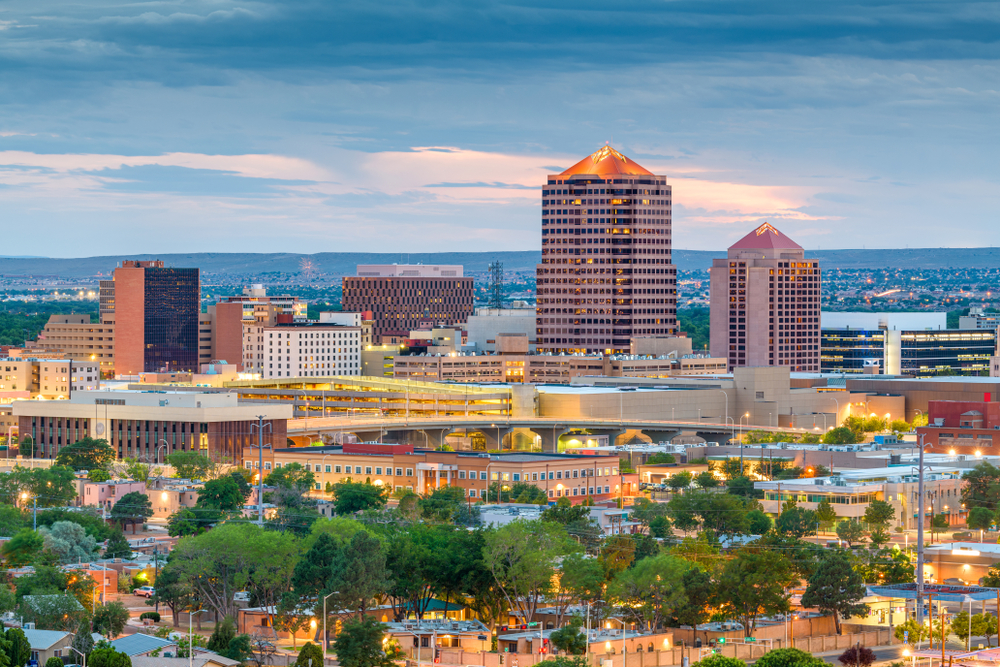
Photo Credit: Sean Pavone / Shutterstock
14. New Mexico
- Used as a share of total vehicle purchase value: 41.44%
- Used vehicle spending per capita: $568
- Total used vehicle spending: $1,195,700,000
- Total new vehicle spending: $1,690,000,000

Photo Credit: Sean Pavone / Shutterstock
13. Tennessee
- Used as a share of total vehicle purchase value: 41.51%
- Used vehicle spending per capita: $590
- Total used vehicle spending: $4,066,600,000
- Total new vehicle spending: $5,729,800,000

Photo Credit: Jonathannsegal / Shutterstock
12. Nebraska
- Used as a share of total vehicle purchase value: 41.78%
- Used vehicle spending per capita: $847
- Total used vehicle spending: $1,641,800,000
- Total new vehicle spending: $2,287,900,000
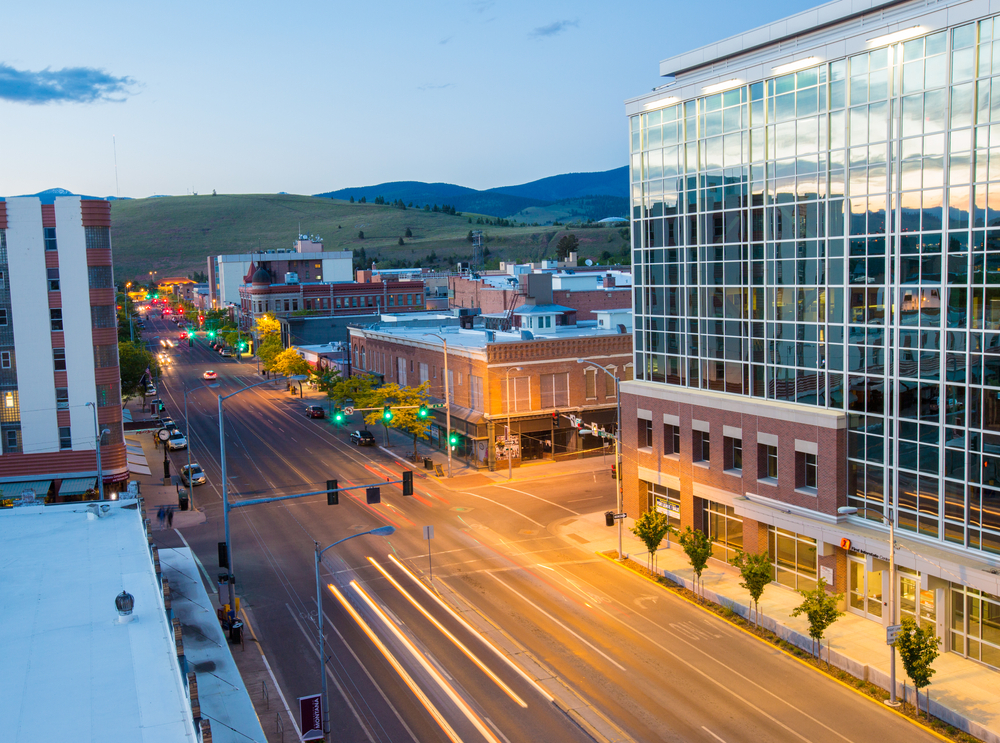
Photo Credit: Mary Vanier / Shutterstock
11. Montana
- Used as a share of total vehicle purchase value: 41.84%
- Used vehicle spending per capita: $803
- Total used vehicle spending: $867,800,000
- Total new vehicle spending: $1,206,500,000
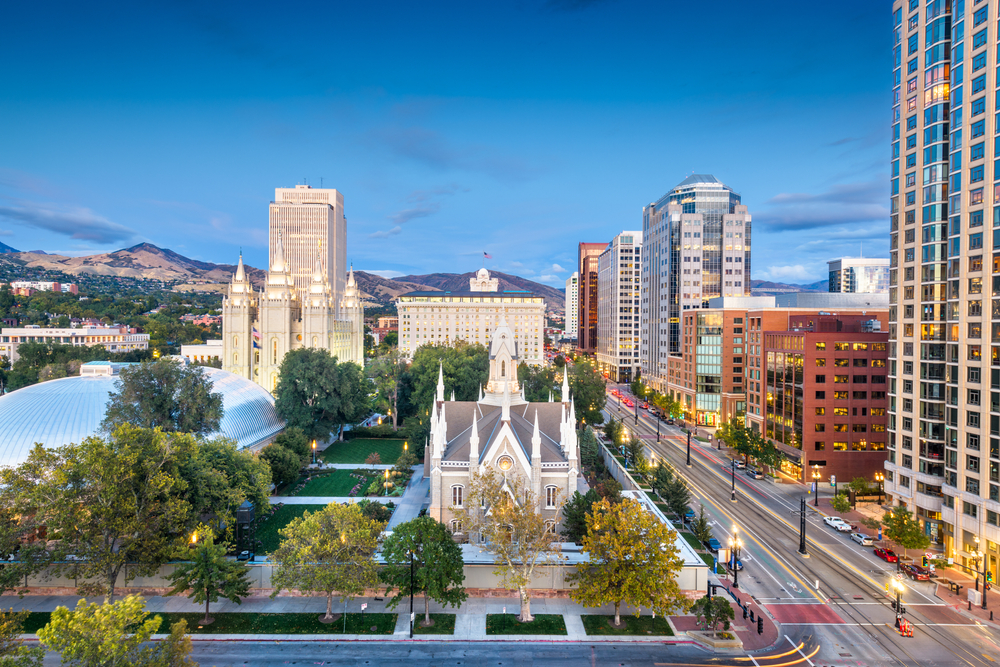
Photo Credit: Sean Pavone / Shutterstock
10. Utah
- Used as a share of total vehicle purchase value: 43.29%
- Used vehicle spending per capita: $735
- Total used vehicle spending: $2,389,300,000
- Total new vehicle spending: $3,130,200,000
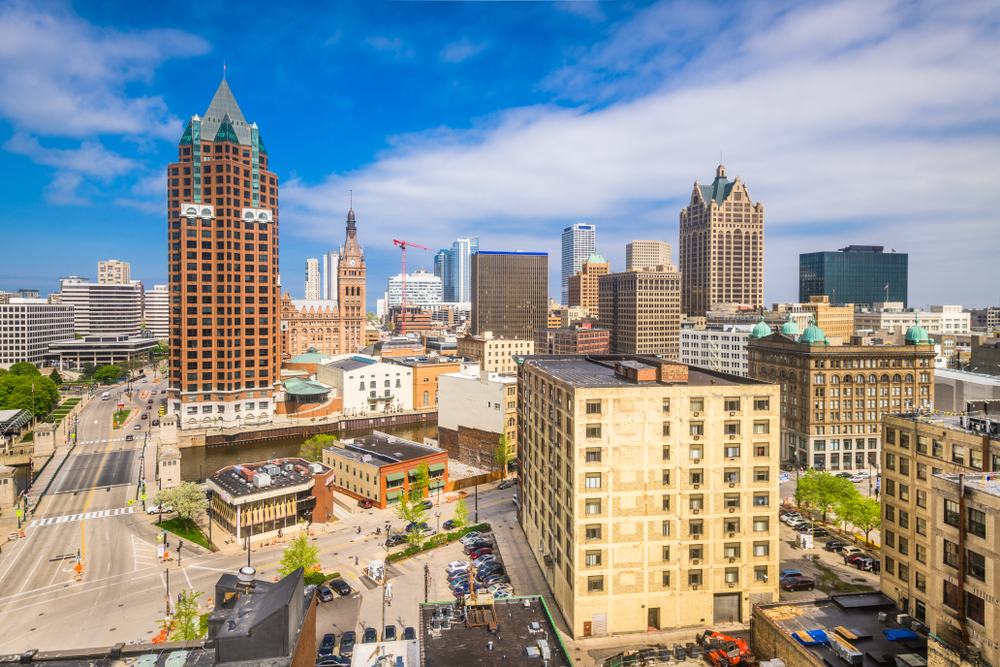
Photo Credit: Sean Pavone / Shutterstock
9. Wisconsin
- Used as a share of total vehicle purchase value: 43.33%
- Used vehicle spending per capita: $699
- Total used vehicle spending: $4,075,000,000
- Total new vehicle spending: $5,330,300,000
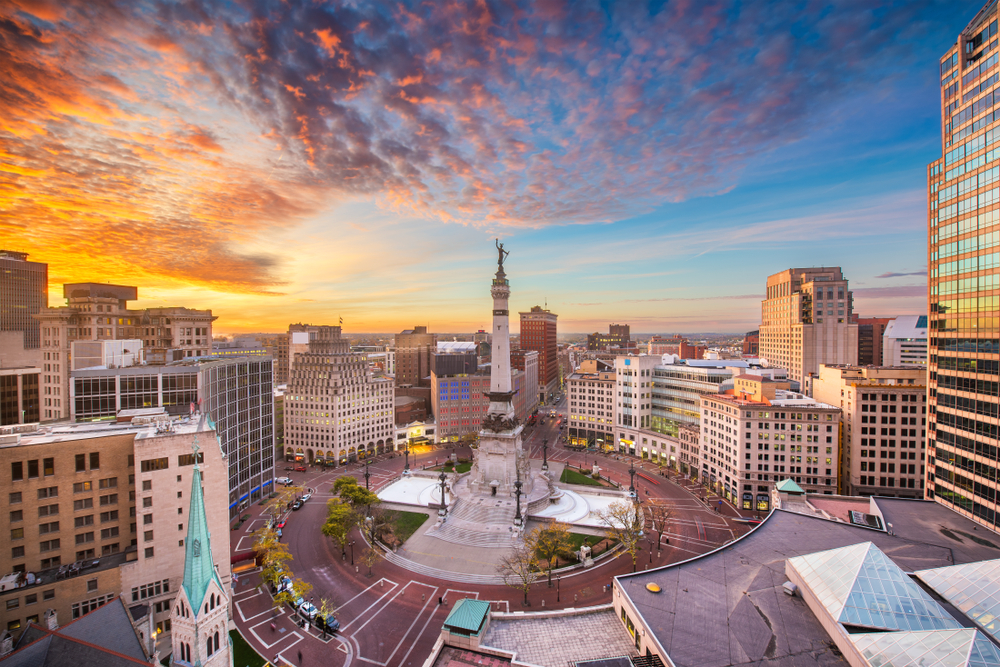
Photo Credit: Sean Pavone / Shutterstock
8. Indiana
- Used as a share of total vehicle purchase value: 44.34%
- Used vehicle spending per capita: $662
- Total used vehicle spending: $4,470,000,000
- Total new vehicle spending: $5,610,200,000
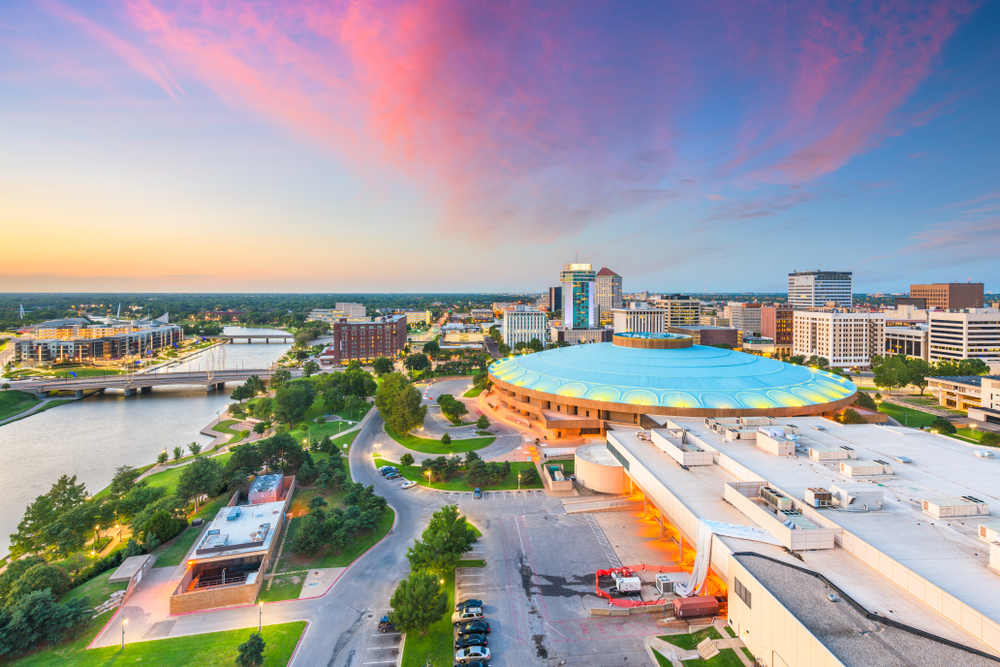
Photo Credit: Sean Pavone / Shutterstock
7. Kansas
- Used as a share of total vehicle purchase value: 44.61%
- Used vehicle spending per capita: $687
- Total used vehicle spending: $2,002,400,000
- Total new vehicle spending: $2,486,500,000

Photo Credit: photo.ua / Shutterstock
6. Minnesota
- Used as a share of total vehicle purchase value: 44.72%
- Used vehicle spending per capita: $754
- Total used vehicle spending: $4,267,600,000
- Total new vehicle spending: $5,274,300,000
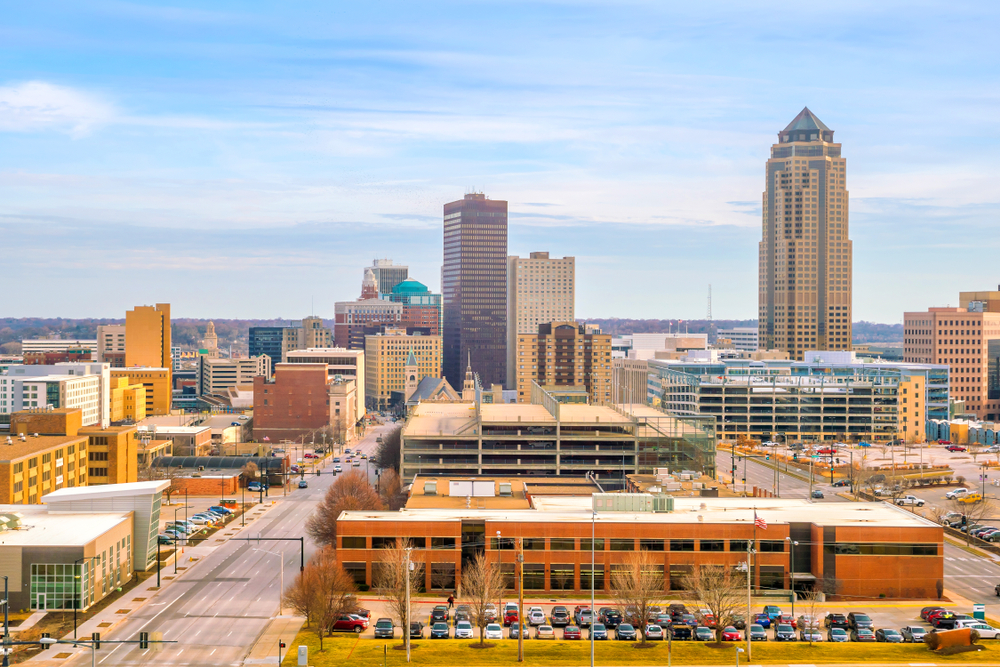
Photo Credit: f11photo / Shutterstock
5. Iowa
- Used as a share of total vehicle purchase value: 45.83%
- Used vehicle spending per capita: $892
- Total used vehicle spending: $2,821,200,000
- Total new vehicle spending: $3,334,700,000
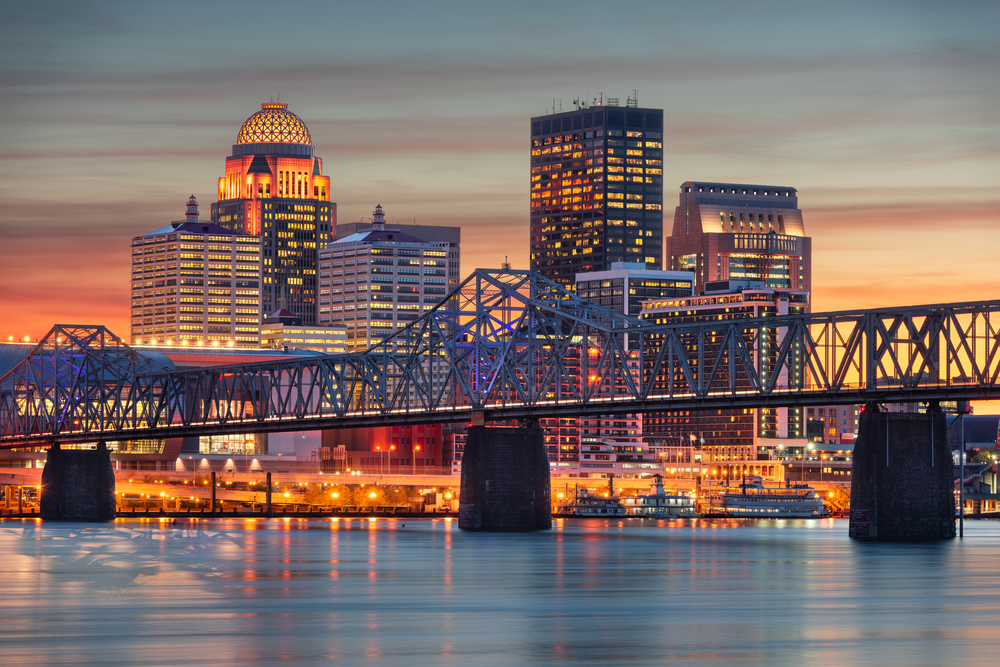
Photo Credit: Sean Pavone / Shutterstock
4. Kentucky
- Used as a share of total vehicle purchase value: 45.96%
- Used vehicle spending per capita: $626
- Total used vehicle spending: $2,800,700,000
- Total new vehicle spending: $3,293,500,000
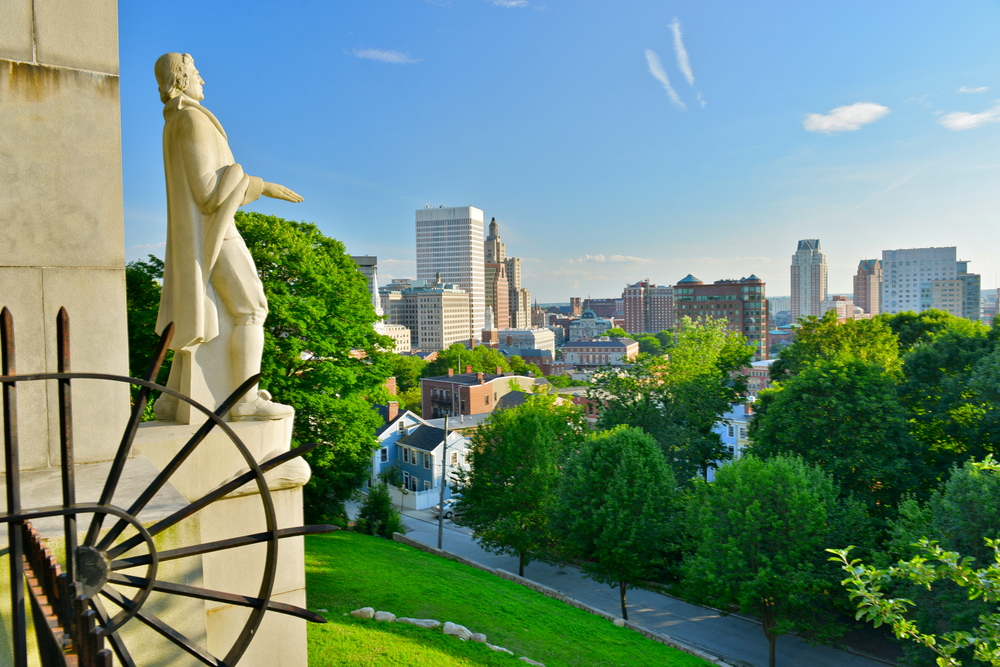
Photo Credit: Richard Cavalleri / Shutterstock
3. Rhode Island
- Used as a share of total vehicle purchase value: 46.69%
- Used vehicle spending per capita: $575
- Total used vehicle spending: $607,600,000
- Total new vehicle spending: $693,700,000
RELATED
CoPilot helps you with every step of the car-buying process so that you save time and get the most for your money. Download the CoPilot app, and start car shopping today.
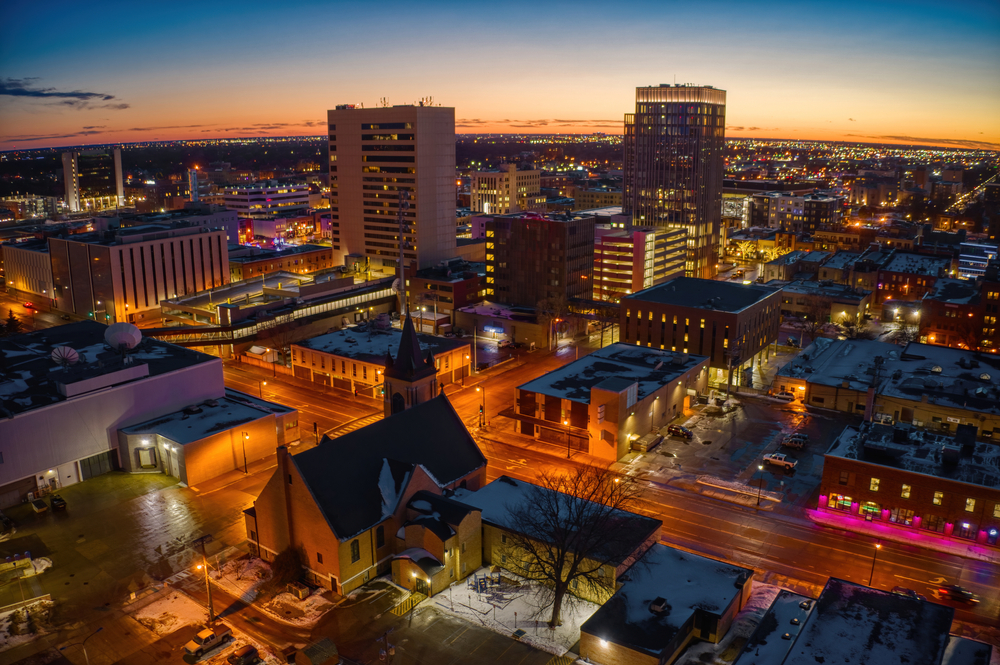
Photo Credit: Jacob Boomsma / Shutterstock
2. North Dakota
- Used as a share of total vehicle purchase value: 47.80%
- Used vehicle spending per capita: $843
- Total used vehicle spending: $645,500,000
- Total new vehicle spending: $705,000,000
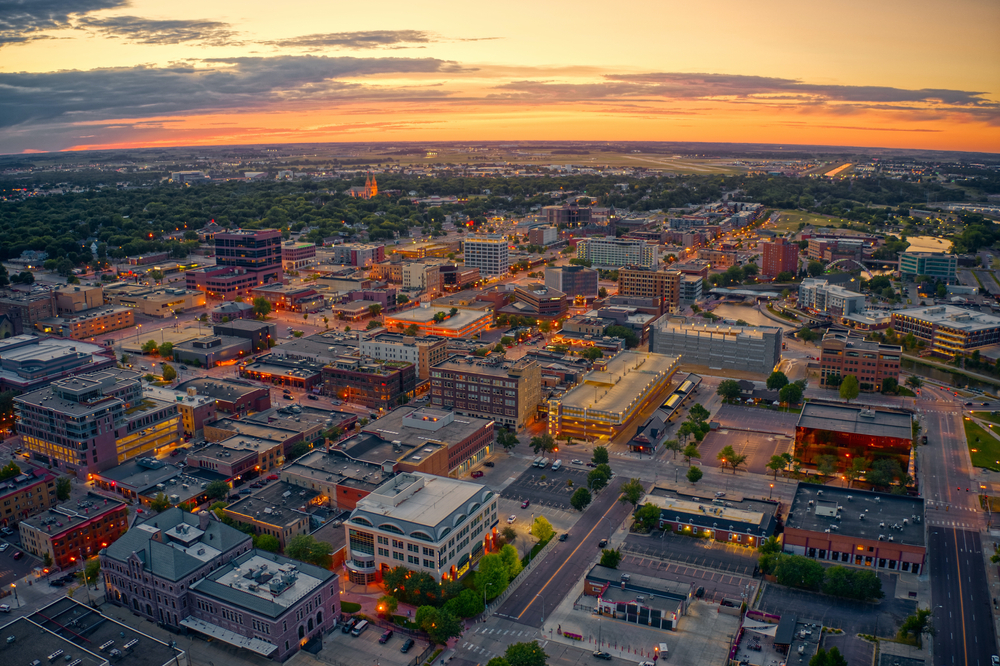
Photo Credit: Jacob Boomsma / Shutterstock
1. South Dakota
- Used as a share of total vehicle purchase value: 48.35%
- Used vehicle spending per capita: $708
- Total used vehicle spending: $631,600,000
- Total new vehicle spending: $674,700,000
Methodology & Detailed Findings
The data used in this analysis is from the U.S. Bureau of Economic Analysis 2020 Personal Consumption Expenditures. To identify the states spending the most on used vs. new cars, researchers calculated the percentage of all vehicle sales (in dollars) accounted for by used vehicle purchases. In the event of a tie, the state with the greater amount of used car spending per capita was ranked higher.
https://infogram.com/1p0l36jp9yyzwriem92gner7xzsn5z5vvdq?live