U.S. States Where People Spend the Most on Cars
Photo Credit: Oaklizm / Shutterstock
Amid recent concerns about inflation in the economy, the market for new and used vehicles is one of the sectors that has drawn the most attention. With the global economy still facing ongoing supply chain challenges—particularly a shortage of semiconductor chips needed for computer systems in modern vehicles—fewer new cars are hitting the market, which has raised demand for pre-owned vehicles. Additionally, rapidly rising gas prices in recent weeks has boosted demand for more fuel-efficient vehicles.
The result has been higher prices for both new and used cars. According to recent data from the Bureau of Labor Statistics, the prices for new vehicles rose 12.4% from February 2021 to February 2022, while used cars and trucks saw price increases of 41.2% last year—one of the largest increases of any category in the Consumer Price Index.
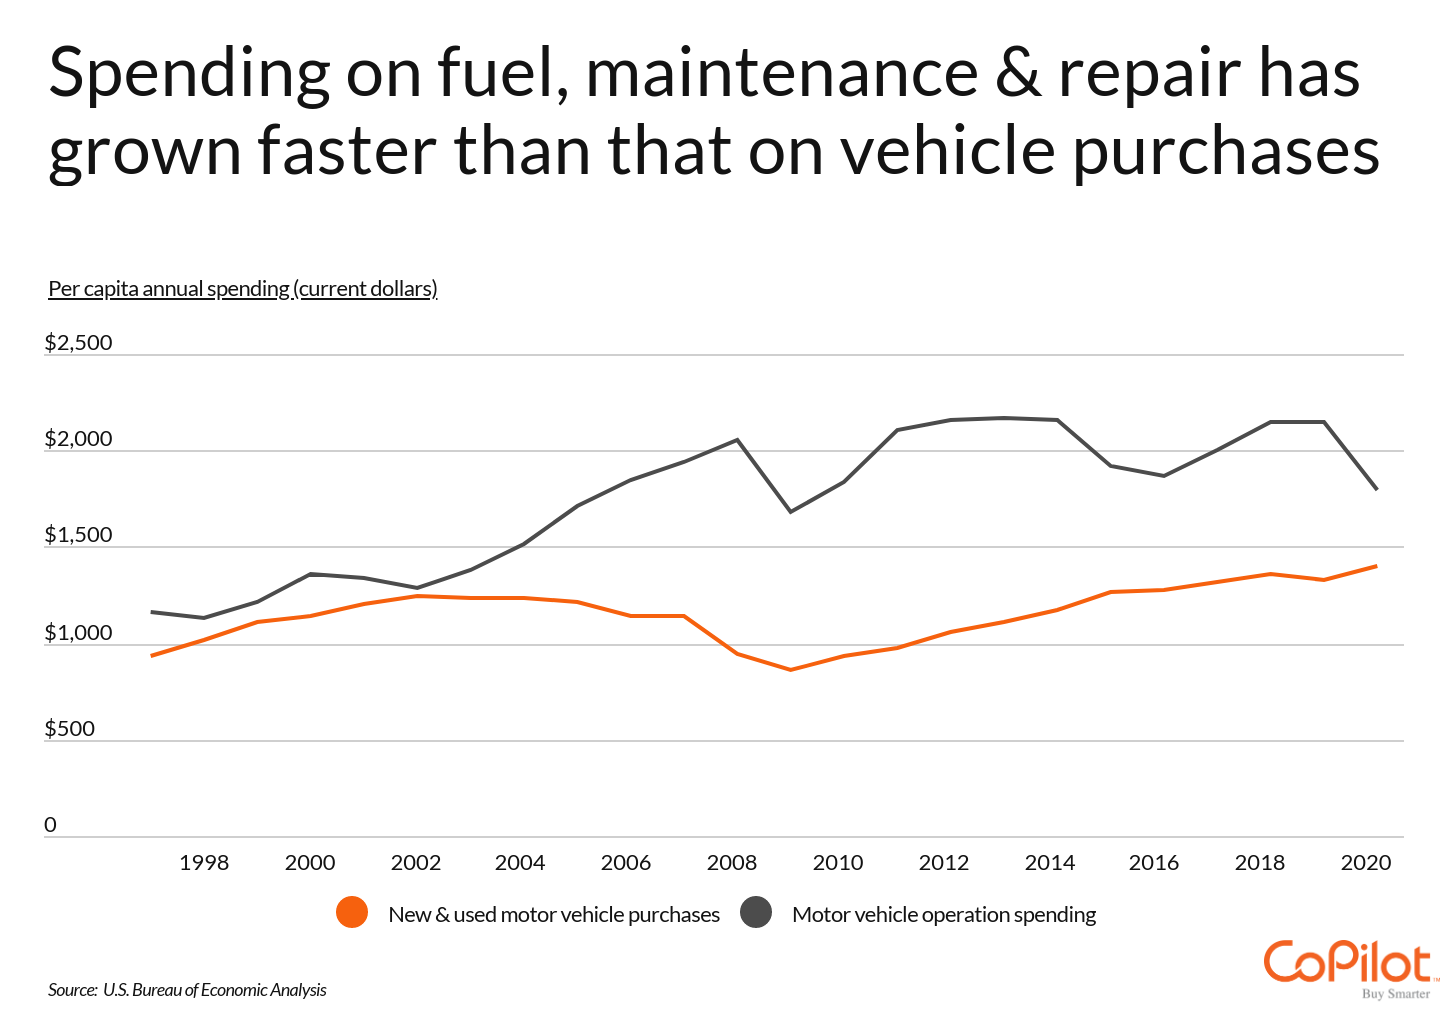
The recent spike in vehicle prices stands out in part because the price for cars has otherwise shown a slow rate of growth in recent years. From 1997 to 2020, per capita annual spending on vehicle purchases rose from $930 to $1,399, which averages out to a 1.8% annualized increase—a figure in line with normal levels of inflation.
But rising vehicle prices recently are worrying for vehicle owners because other costs associated with owning a car have grown more rapidly over time. Costs to operate a vehicle, like gas, maintenance, and parts, grew 84.1%—about 2.8% per year—from $1,166 in 1997 to $2,147 in 2019, before falling in 2020 with the onset of the pandemic.
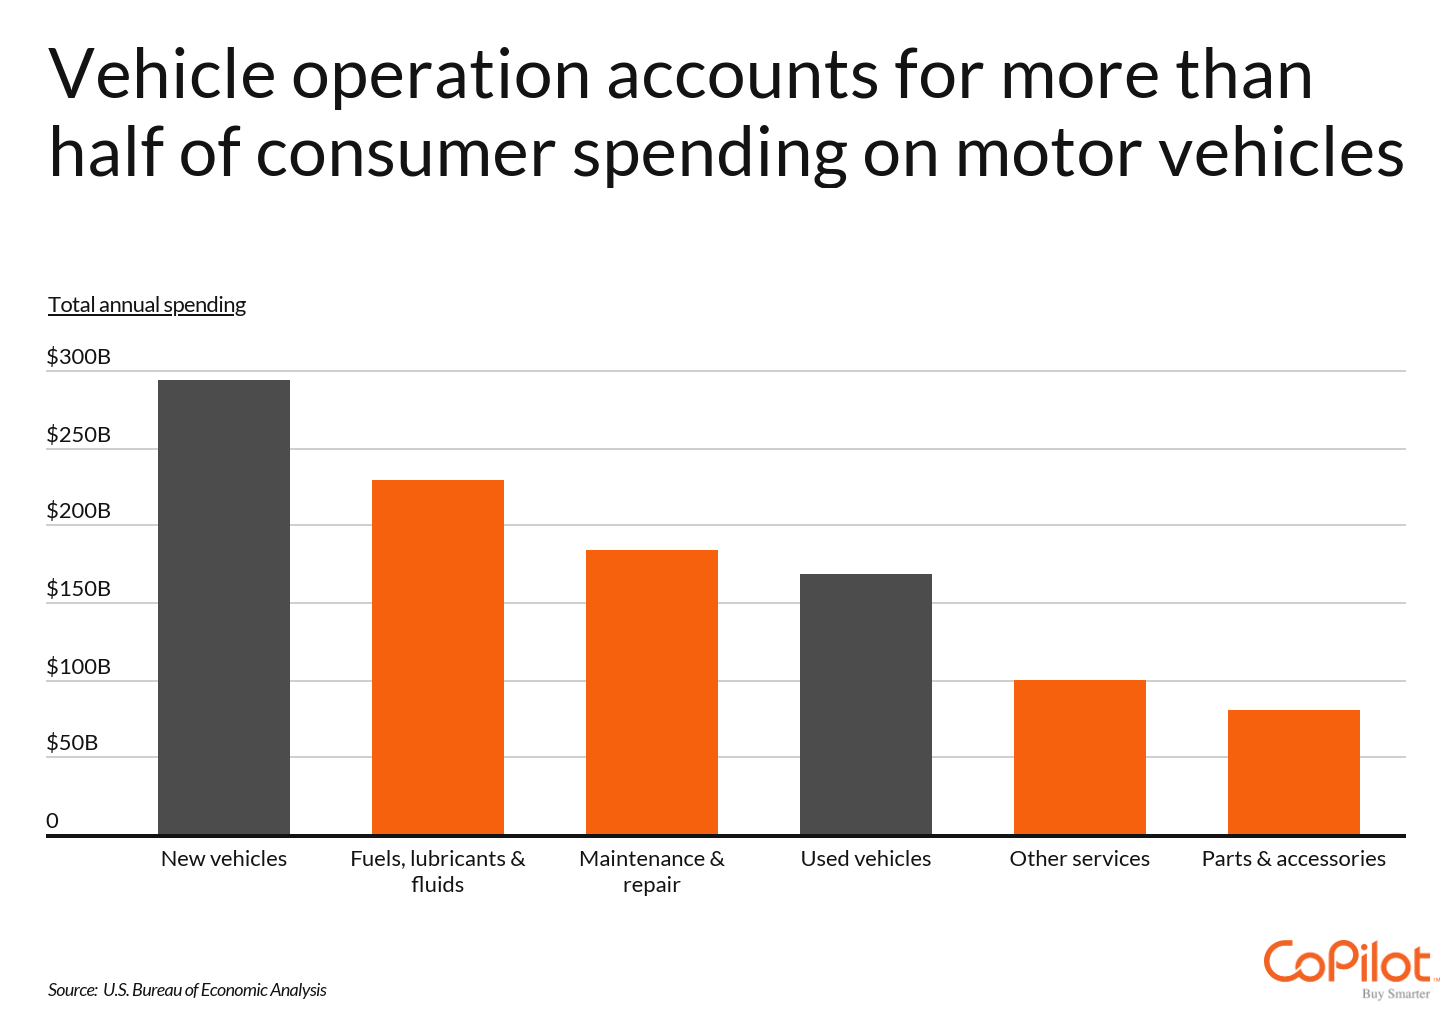
In fact, the cost of operating vehicles accounts for more than half of consumer spending on motor vehicles in the U.S. Total spending on new and used vehicles amounts to nearly $461 billion per year, according to data from the Bureau of Economic Analysis. The combined cost of fuels, lubricants, and fluids; maintenance and repair; other services; and parts and accessories totals more than $591 billion annually—56.2% of all dollars spent in the category.
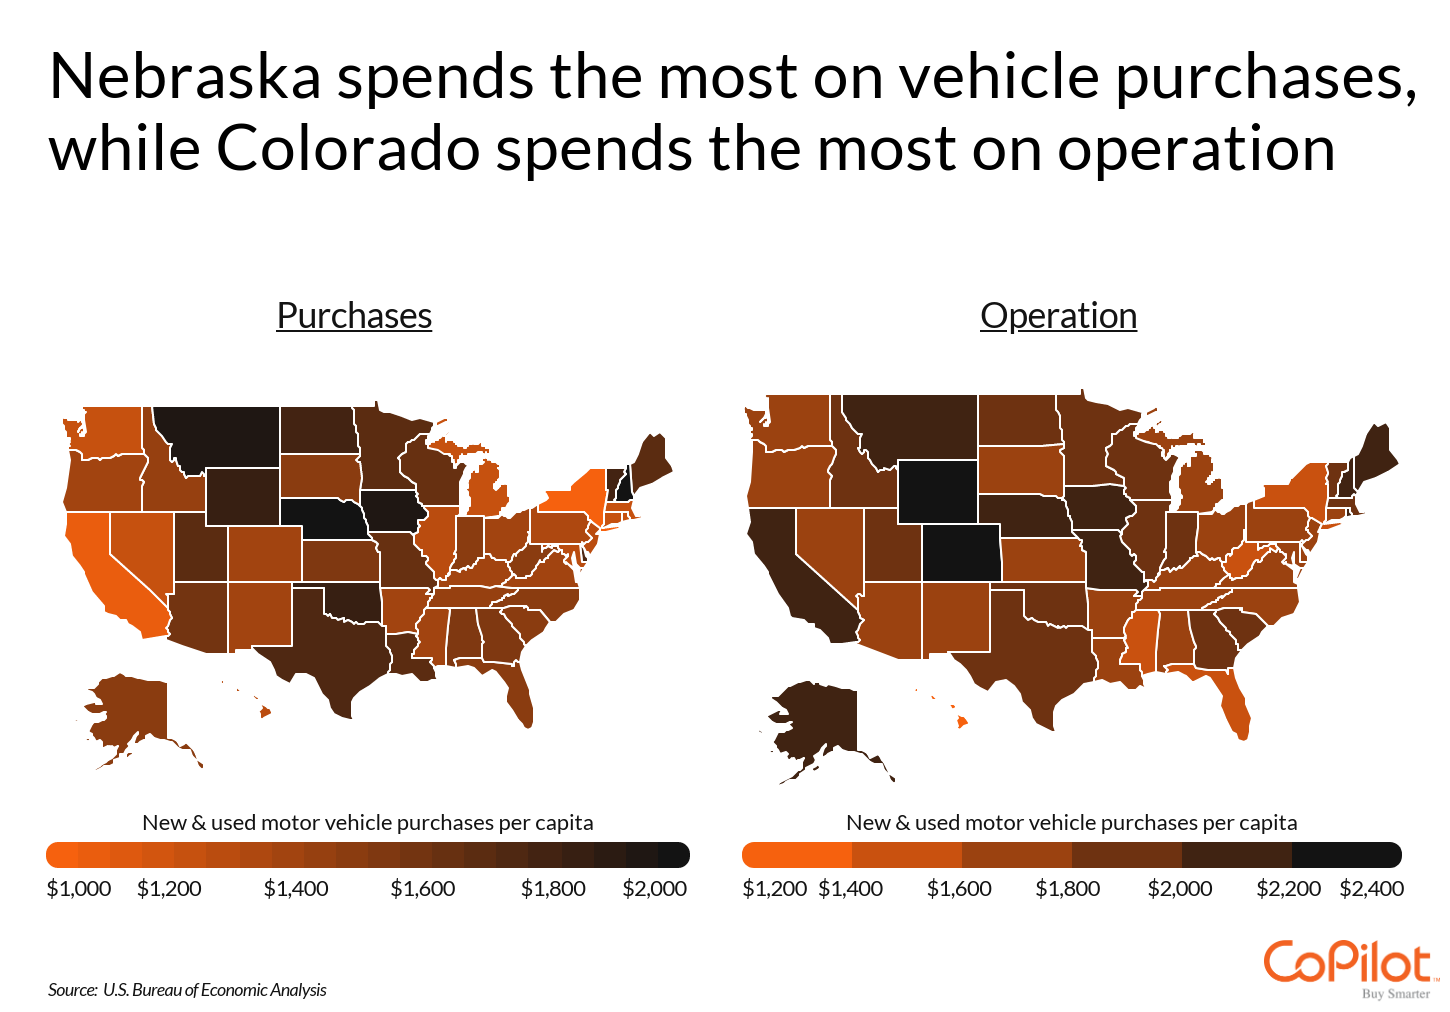
However, spending on vehicle purchases and operations can vary significantly by state. Most of the states spending highly on both purchases and operations are found in the Plains and Mountain West regions. These leading states are less densely populated, which makes car travel vital, and also have harsher winters than other parts of the country, which reduces fuel economy and may increase the need for additional parts or maintenance. At $2,028, Nebraska leads the nation in annual per capita spending on vehicle purchases—the only state to top $2,000—while neighboring Colorado leads in per capita spending on operation at $2,330. But the most expensive state for car owners overall is found in the Northeast. The residents of New Hampshire spend $4,195 per capita on vehicle purchases and operation each year, just edging out Nebraska, where the annual spending totals $4,193.
DID YOU KNOW?
Shopping for a used car doesn’t have to be complicated. If you’re looking for a clear, easy-to-understand rating that tells you whether to buy, pause, or walk away, CoPilot has you covered. Download the CoPilot app today.
The data used in this analysis is from the U.S. Bureau of Economic Analysis 2020 Personal Consumption Expenditures. To identify the states spending the most on cars, researchers at CoPilot calculated total motor vehicle spending per capita in 2020, which includes both new and used vehicle purchases as well as vehicle operation expenses. Vehicle operation includes spending on fuels, lubricants, and fluids; maintenance and repairs; parts and accessories; and other motor vehicle services.
Here are the states spending the most on motor vehicles.
States Spending the Most on Motor Vehicles
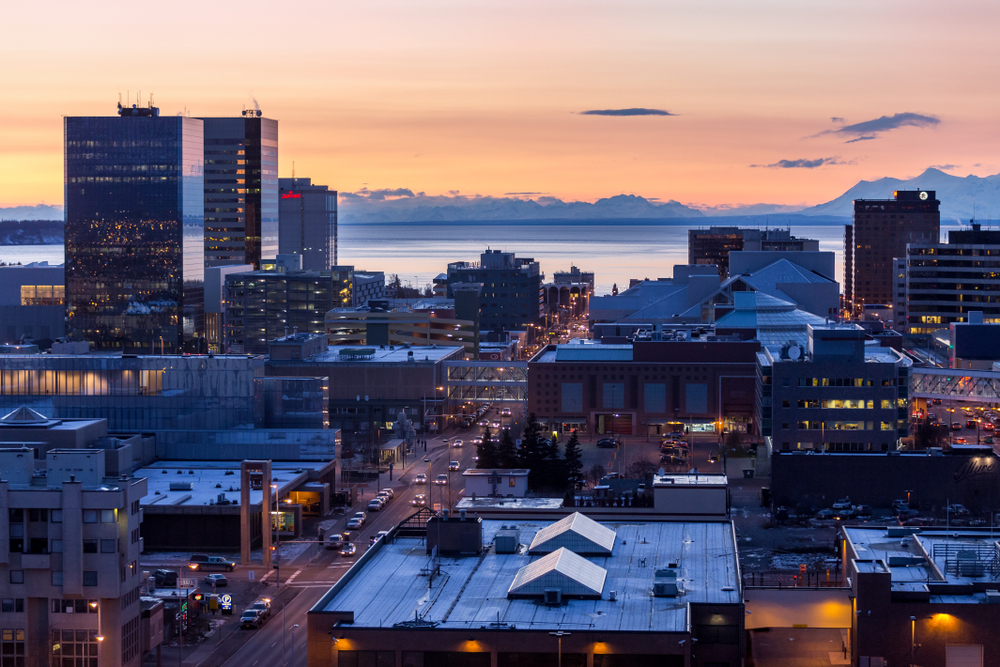
Photo Credit: Marcus Biastock / Shutterstock
15. Alaska
- Total motor vehicle spending per capita: $3,563
- New & used motor vehicle purchases: $1,467
- Motor vehicle fuels, lubricants, & fluids: $507
- Motor vehicle maintenance & repair: $661
- Motor vehicle parts & accessories: $389
- Other motor vehicle services: $539
RELATED
CoPilot can help you find great deals on used cars. Use our Price Pulse to pinpoint the best time to buy a used car.
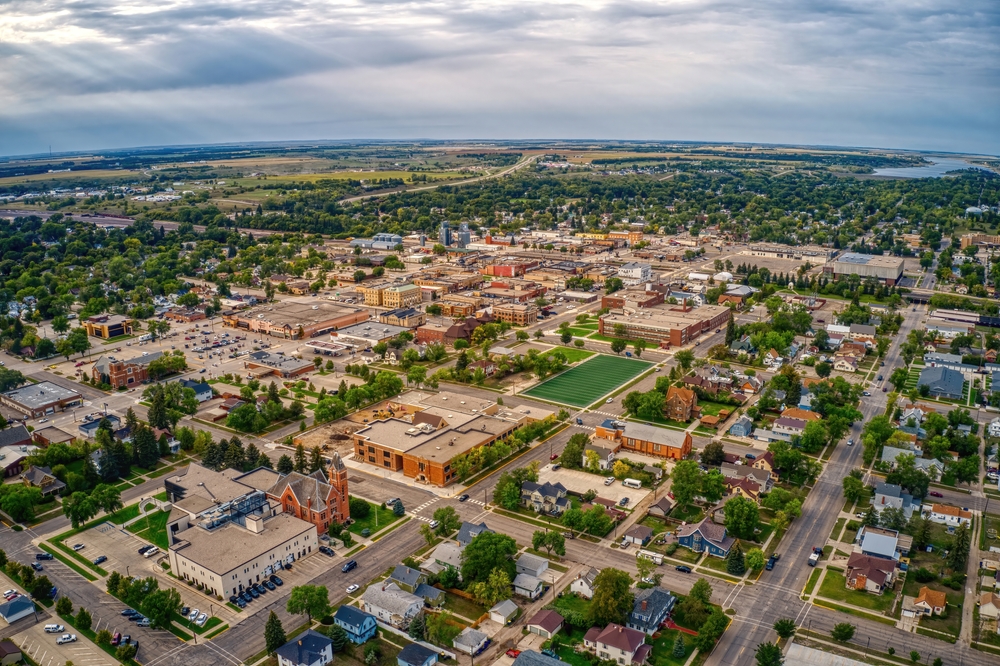
Photo Credit: Jacob Boomsma / Shutterstock
14. North Dakota
- Total motor vehicle spending per capita: $3,572
- New & used motor vehicle purchases: $1,765
- Motor vehicle fuels, lubricants, & fluids: $613
- Motor vehicle maintenance & repair: $679
- Motor vehicle parts & accessories: $290
- Other motor vehicle services: $227
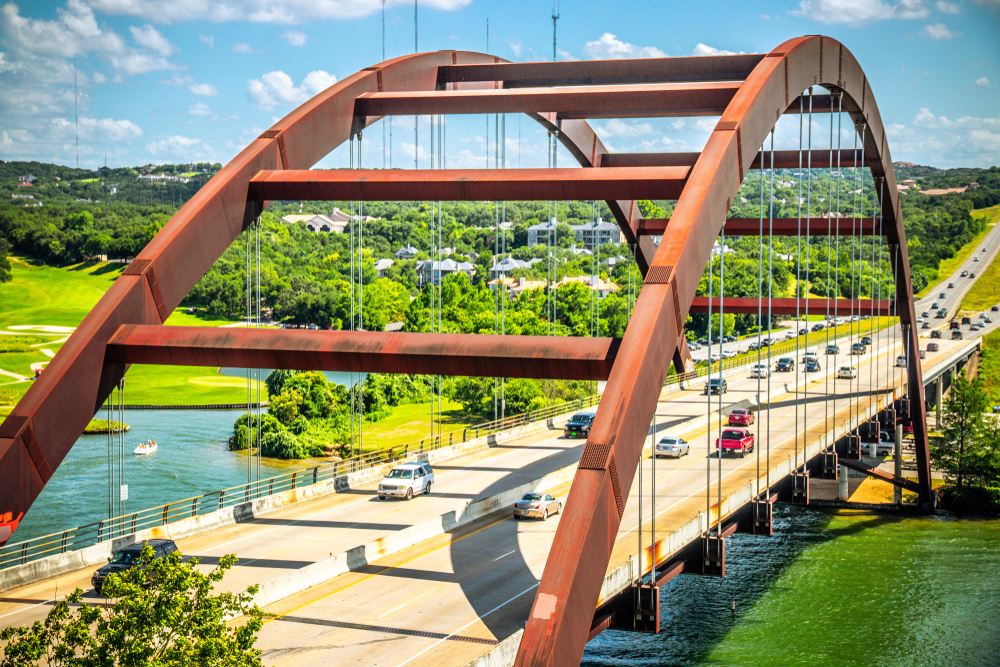
Photo Credit: ShengYing Lin / Shutterstock
13. Texas
- Total motor vehicle spending per capita: $3,615
- New & used motor vehicle purchases: $1,740
- Motor vehicle fuels, lubricants, & fluids: $781
- Motor vehicle maintenance & repair: $552
- Motor vehicle parts & accessories: $227
- Other motor vehicle services: $315
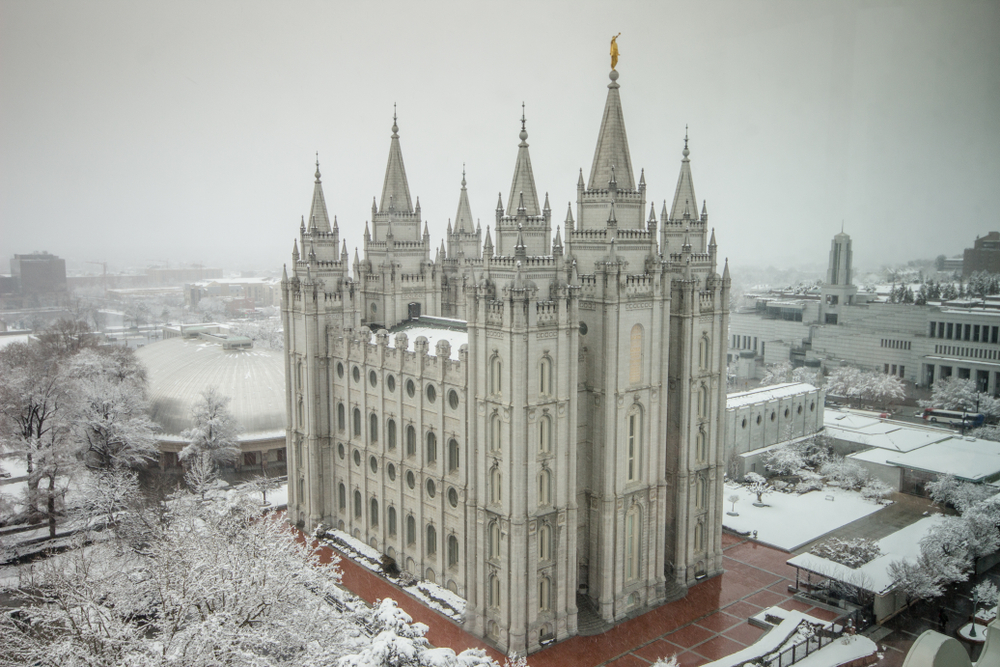
Photo Credit: Globe Guide Media Inc / Shutterstock
12. Utah
- Total motor vehicle spending per capita: $3,627
- New & used motor vehicle purchases: $1,698
- Motor vehicle fuels, lubricants, & fluids: $762
- Motor vehicle maintenance & repair: $611
- Motor vehicle parts & accessories: $321
- Other motor vehicle services: $235
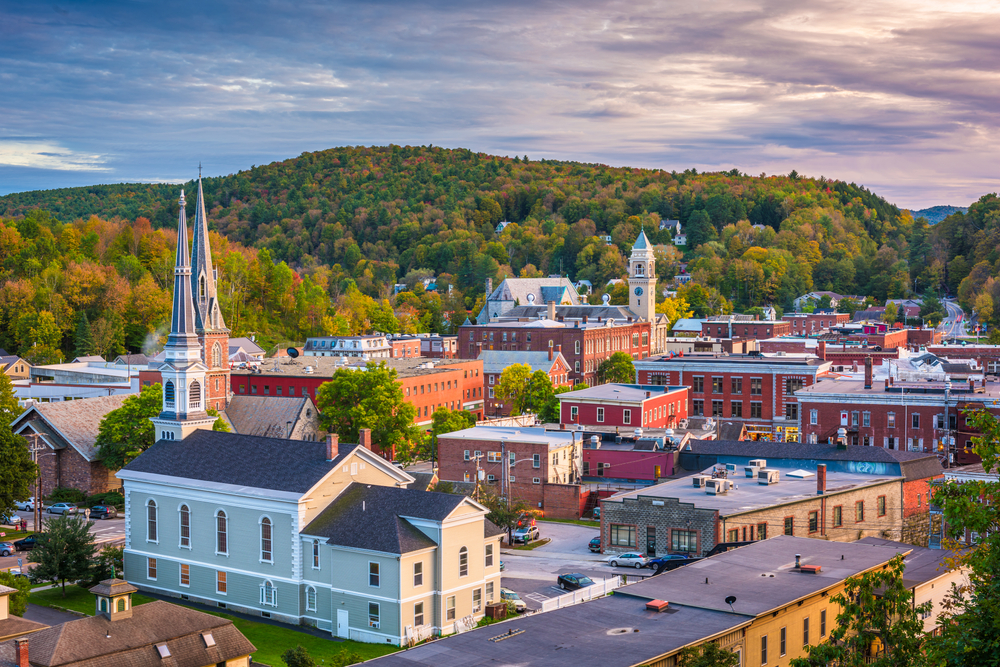
Photo Credit: Sean Pavone / Shutterstock
11. Vermont
- Total motor vehicle spending per capita: $3,632
- New & used motor vehicle purchases: $1,755
- Motor vehicle fuels, lubricants, & fluids: $784
- Motor vehicle maintenance & repair: $668
- Motor vehicle parts & accessories: $290
- Other motor vehicle services: $135
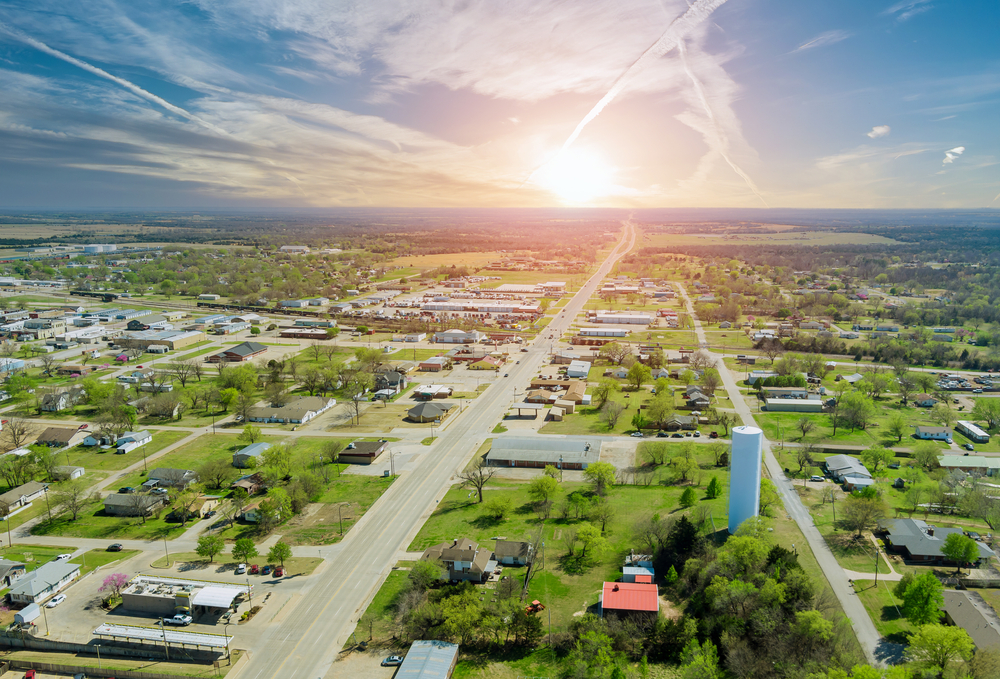
Photo Credit: ungvar / Shutterstock
10. Oklahoma
- Total motor vehicle spending per capita: $3,654
- New & used motor vehicle purchases: $1,823
- Motor vehicle fuels, lubricants, & fluids: $924
- Motor vehicle maintenance & repair: $408
- Motor vehicle parts & accessories: $244
- Other motor vehicle services: $254

Photo Credit: photo.ua / Shutterstock
9. Minnesota
- Total motor vehicle spending per capita: $3,675
- New & used motor vehicle purchases: $1,687
- Motor vehicle fuels, lubricants, & fluids: $811
- Motor vehicle maintenance & repair: $655
- Motor vehicle parts & accessories: $312
- Other motor vehicle services: $210

Photo Credit: Roschetzky Photography / Shutterstock
8. Colorado
- Total motor vehicle spending per capita: $3,700
- New & used motor vehicle purchases: $1,370
- Motor vehicle fuels, lubricants, & fluids: $714
- Motor vehicle maintenance & repair: $826
- Motor vehicle parts & accessories: $404
- Other motor vehicle services: $386
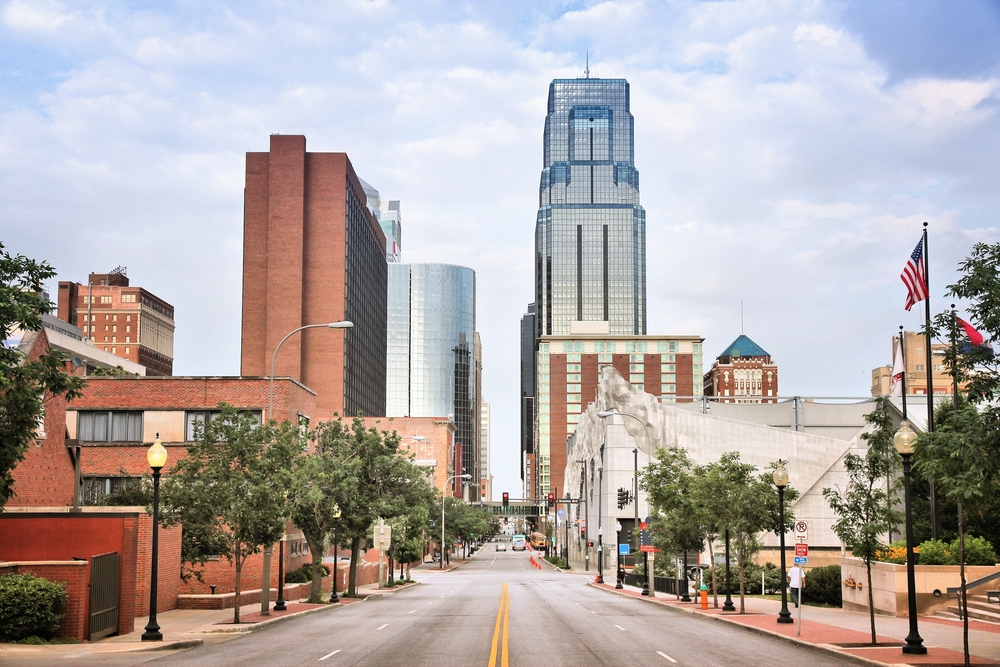
Photo Credit: Tupungato / Shutterstock
7. Missouri
- Total motor vehicle spending per capita: $3,779
- New & used motor vehicle purchases: $1,610
- Motor vehicle fuels, lubricants, & fluids: $982
- Motor vehicle maintenance & repair: $625
- Motor vehicle parts & accessories: $262
- Other motor vehicle services: $300
Photo Credit: KWJPHOTOART / Shutterstock
6. Maine
- Total motor vehicle spending per capita: $3,805
- New & used motor vehicle purchases: $1,690
- Motor vehicle fuels, lubricants, & fluids: $988
- Motor vehicle maintenance & repair: $623
- Motor vehicle parts & accessories: $282
- Other motor vehicle services: $223

Photo Credit: Jim Cork / Shutterstock
5. Iowa
- Total motor vehicle spending per capita: $4,015
- New & used motor vehicle purchases: $1,946
- Motor vehicle fuels, lubricants, & fluids: $1,028
- Motor vehicle maintenance & repair: $613
- Motor vehicle parts & accessories: $290
- Other motor vehicle services: $138
Photo Credit: Jess Kraft / Shutterstock
4. Wyoming
- Total motor vehicle spending per capita: $4,068
- New & used motor vehicle purchases: $1,837
- Motor vehicle fuels, lubricants, & fluids: $846
- Motor vehicle maintenance & repair: $695
- Motor vehicle parts & accessories: $448
- Other motor vehicle services: $241
Photo Credit: Mihai_Andritoiu / Shutterstock
3. Montana
- Total motor vehicle spending per capita: $4,073
- New & used motor vehicle purchases: $1,920
- Motor vehicle fuels, lubricants, & fluids: $829
- Motor vehicle maintenance & repair: $722
- Motor vehicle parts & accessories: $372
- Other motor vehicle services: $230
DID YOU KNOW?
Gap insurance: If you owe $15K on your car when you total it, and your insurance company only pays out $12K, you’d typically be stuck owing the $3K difference. Gap insurance would pay that difference, protecting you from having to pay for a car that you can no longer drive. So is gap insurance worth it? That depends on what car you drive and how much you owe on it.

Photo Credit: DomVisuals / Shutterstock
2. Nebraska
- Total motor vehicle spending per capita: $4,193
- New & used motor vehicle purchases: $2,028
- Motor vehicle fuels, lubricants, & fluids: $1,039
- Motor vehicle maintenance & repair: $683
- Motor vehicle parts & accessories: $268
- Other motor vehicle services: $175

Photo Credit: Jon Bilous / Shutterstock
1. New Hampshire
- Total motor vehicle spending per capita: $4,195
- New & used motor vehicle purchases: $1,999
- Motor vehicle fuels, lubricants, & fluids: $828
- Motor vehicle maintenance & repair: $812
- Motor vehicle parts & accessories: $239
- Other motor vehicle services: $317
Methodology & Detailed Findings
The data used in this analysis is from the U.S. Bureau of Economic Analysis 2020 Personal Consumption Expenditures. To identify the states spending the most on cars, researchers calculated total motor vehicle spending per capita in 2020, which includes both new and used vehicle purchases as well as vehicle operation spending. Vehicle operation spending includes spending on fuels, lubricants, and fluids; maintenance and repairs; parts and accessories; and other motor vehicle services.
https://infogram.com/1pnme17j3mr6zrczwz5k1x3qvvhm9pnnzl1?live