States With the Biggest Increase in Used Vehicle Purchases During COVID-19

Photo Credit: RossHelen / Shutterstock
Inflation has been the dominant story in the U.S. economy for most of the last year. Year-over-year increases in the Consumer Price Index have reached their highest levels in 40 years, with consumers paying more for expenses from food to housing to energy. And one of the categories that has consistently seen the highest price increases in this inflationary period is vehicles, both new and used.
While the early months of the COVID-19 pandemic saw lower demand for vehicles as people avoided travel and commuting, the vehicle market has rebounded strongly since the second half of 2020. COVID-related concerns and transitions to remote or hybrid work have put a dent in public transit ridership, and instead, more former transit users have opted to buy cars. Low interest rates, strong government stimulus, and a rebounding economy have given many households the wherewithal to make vehicle purchases.A lingering challenge, however, has been supply. COVID-19 outbreaks over the last two years have disrupted global supply chains, and carmakers have been particularly hard hit. Obtaining parts like semiconductor chips has been more challenging, and backlogs at ports worldwide have made it harder to ship new vehicles. In total, manufacturers produced approximately 1.7 million fewer vehicles in 2021 than 2019, and with a limited number of new vehicles hitting the market, used models are selling at a significant premium.
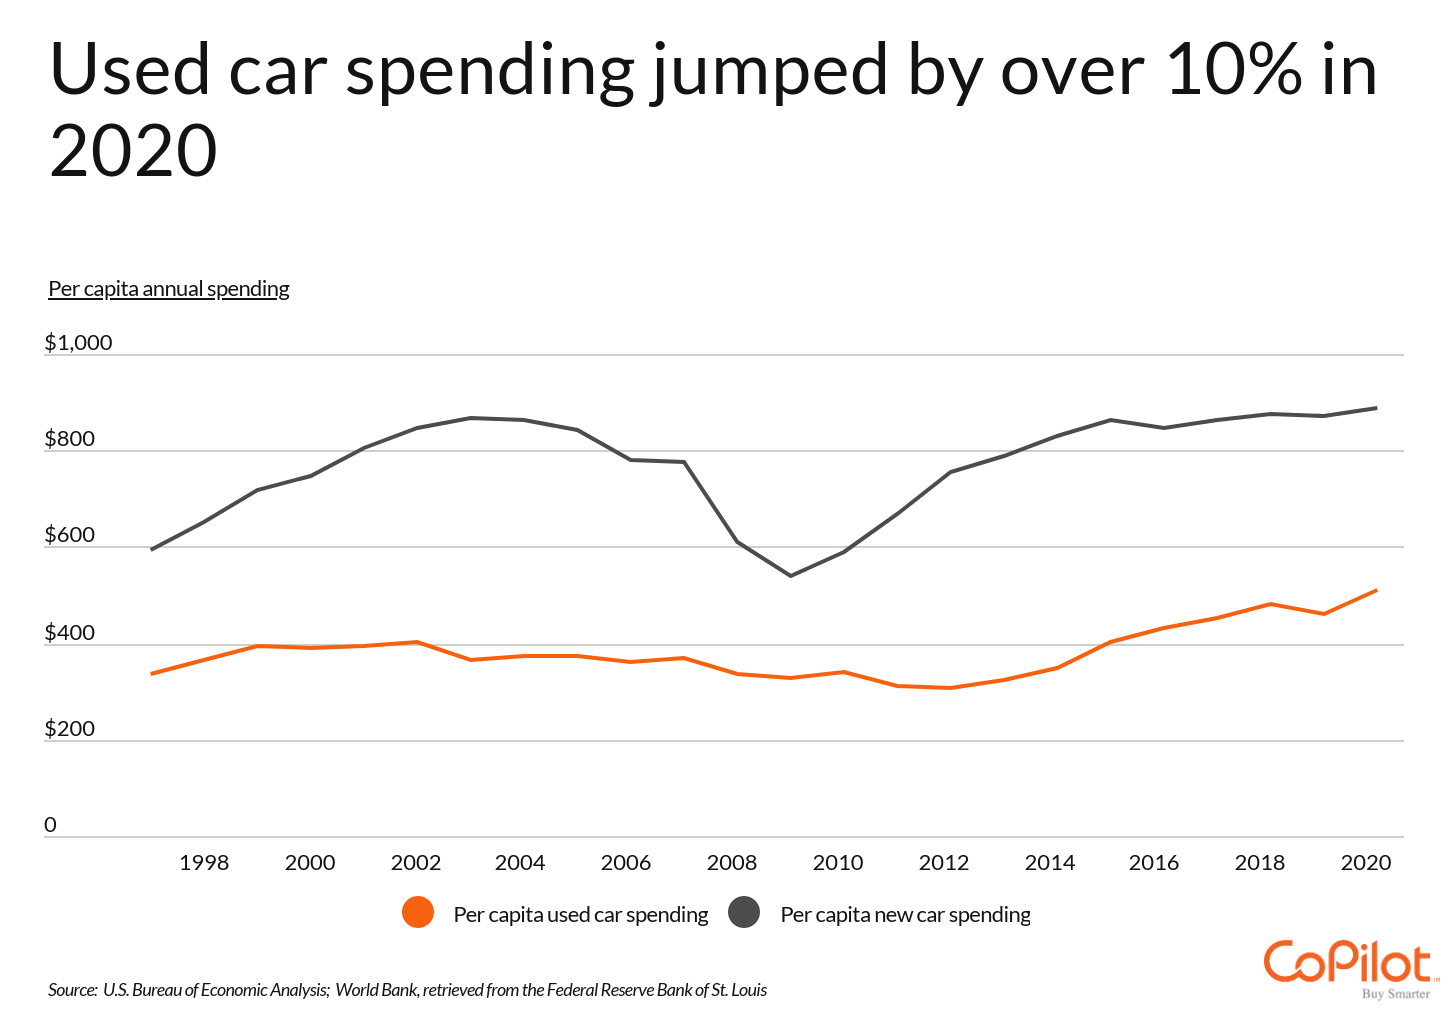
According to data from the U.S. Bureau of Economic Analysis, per capita annual spending on used cars jumped 10.9% between 2019 and 2020, from $460 to $510. This increase was the second highest single-year increase in nearly 25 years. The new vehicle market is historically prone to larger swings, but spending on new vehicles only increased by about 2.1% from 2019 to 2020, from $870 to $889.
RELATED
Is gap insurance worth it? Sometimes, an insurance claim will pay out less than what your car is worth, and you end up owing money out-of-pocket to cover the difference. Gap insurance provides coverage when your auto insurance falls short.
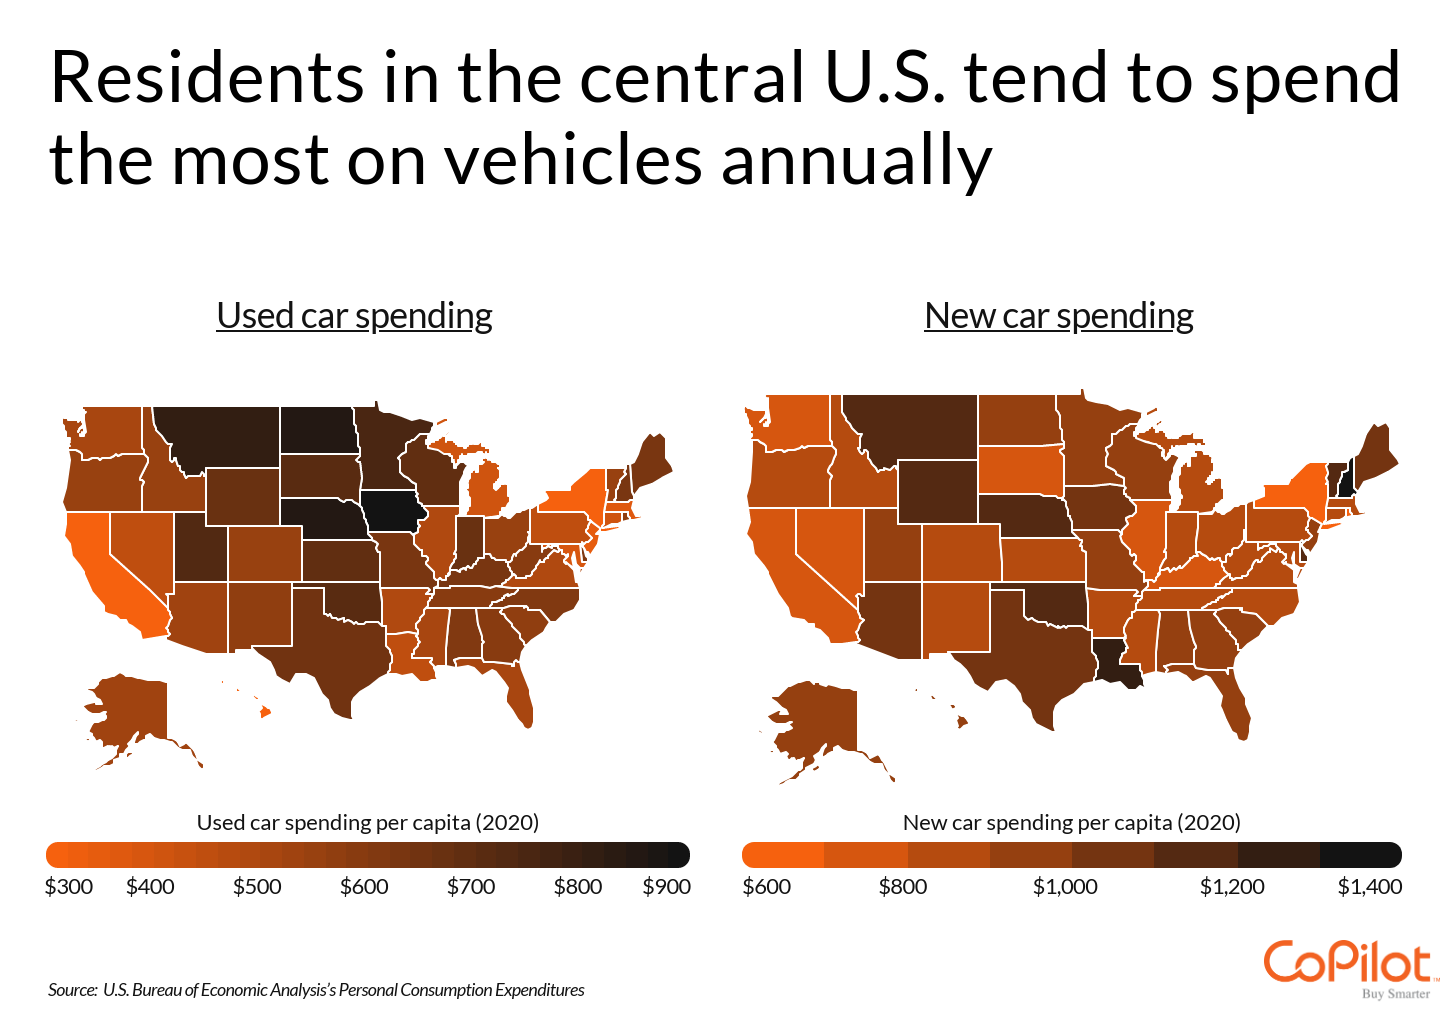
Car shoppers in some locations have felt the effects of these price increases more than others. Typically, residents of the central U.S. tend to spend the most on both new and used vehicles annually. Residents in these locations are typically more car-dependent because their rural geography puts more distance between people and communities. While residents of less car-oriented locations can spend less or put off vehicle purchases more easily, their car-dependent peers spend more—and now are carrying the extra burden of rising prices.
The data used in this analysis is from the U.S. Bureau of Economic Analysis’s Personal Consumption Expenditures. To determine the states with the biggest increase in used vehicle purchases during COVID-19, researchers at CoPilot calculated the percentage change in total used car spending between 2019 and 2020. In the event of a tie, the state with the greater total change in used car spending over the same time period was ranked higher.
Here are the states with the biggest increase in used vehicle purchases during COVID-19.
States With the Biggest Increase in Used Vehicle Purchases
Photo Credit: The Speedy Butterfly / Shutterstock
15. Tennessee
- Percentage change in used car spending (2019-2020): +15.4%
- Total change in used car spending (2019-2020): +$544,100,000
- Used car spending per capita (2020): $590
- Used car spending per capita (2019): $516
DID YOU KNOW?
CoPilot can help you find great deals on used cars. Use CoPilot’s Price Pulse to pinpoint the best time to buy a used car.

Photo Credit: Sean Pavone / Shutterstock
14. Alabama
- Percentage change in used car spending (2019-2020): +15.5%
- Total change in used car spending (2019-2020): +$396,500,000
- Used car spending per capita (2020): $601
- Used car spending per capita (2019): $523
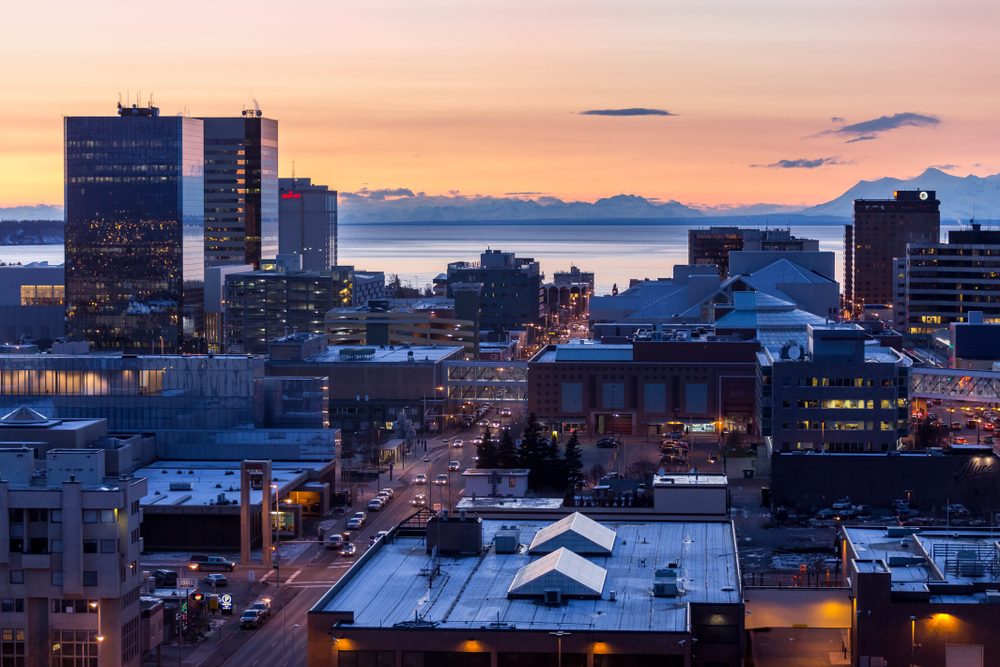
Photo Credit: Marcus Biastock / Shutterstock
13. Alaska
- Percentage change in used car spending (2019-2020): +15.7%
- Total change in used car spending (2019-2020): +$51,700,000
- Used car spending per capita (2020): $522
- Used car spending per capita (2019): $451
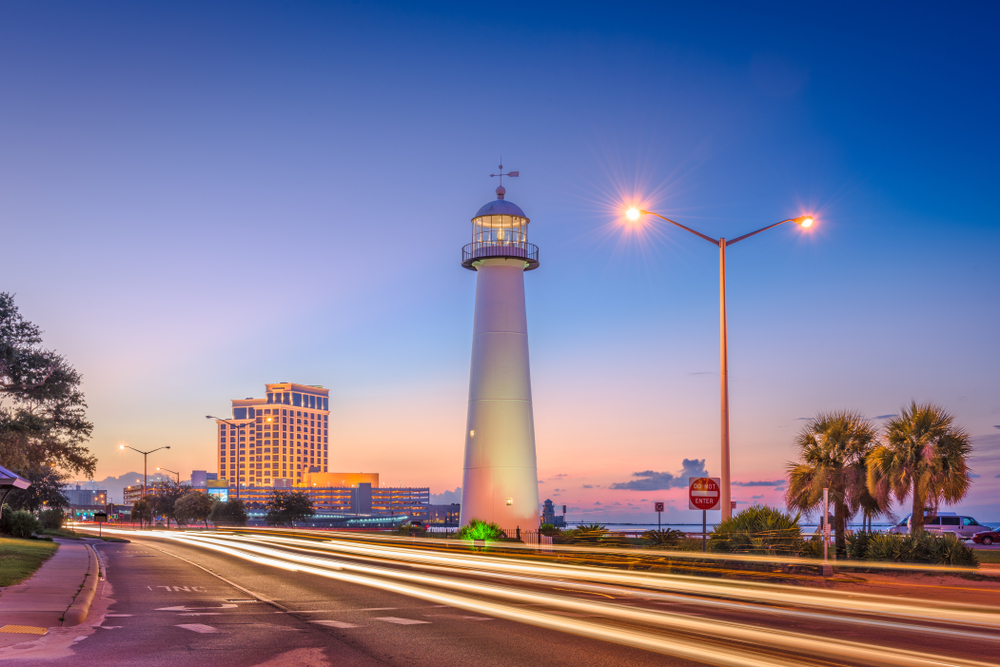
Photo Credit: Sean Pavone / Shutterstock
12. Mississippi
- Percentage change in used car spending (2019-2020): +16.3%
- Total change in used car spending (2019-2020): +$210,900,000
- Used car spending per capita (2020): $508
- Used car spending per capita (2019): $435
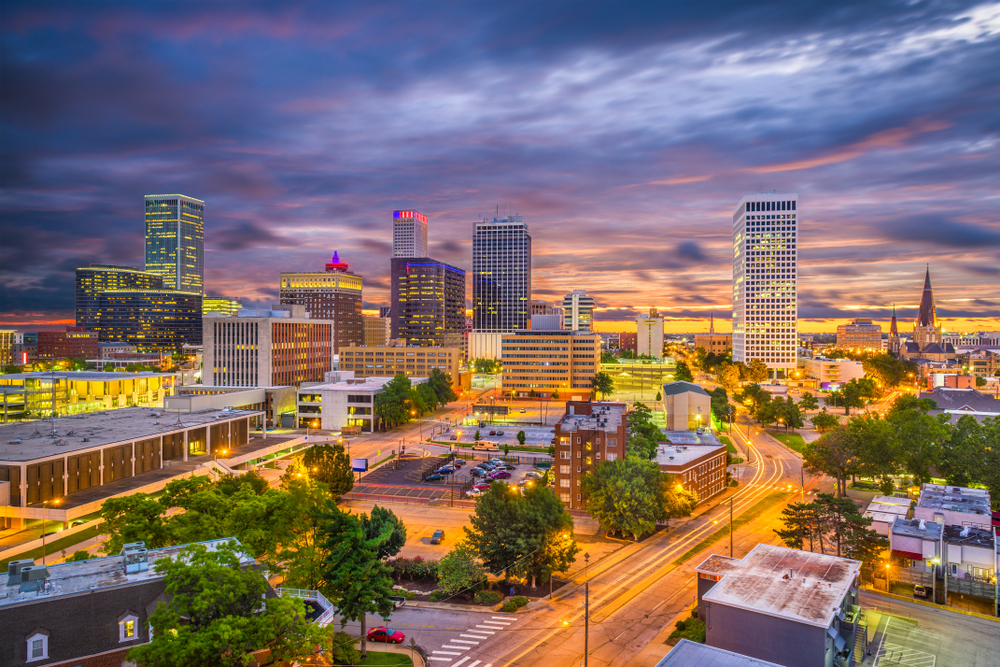
Photo Credit: Sean Pavone / Shutterstock
11. Oklahoma
- Percentage change in used car spending (2019-2020): +16.4%
- Total change in used car spending (2019-2020): +$398,400,000
- Used car spending per capita (2020): $711
- Used car spending per capita (2019): $615
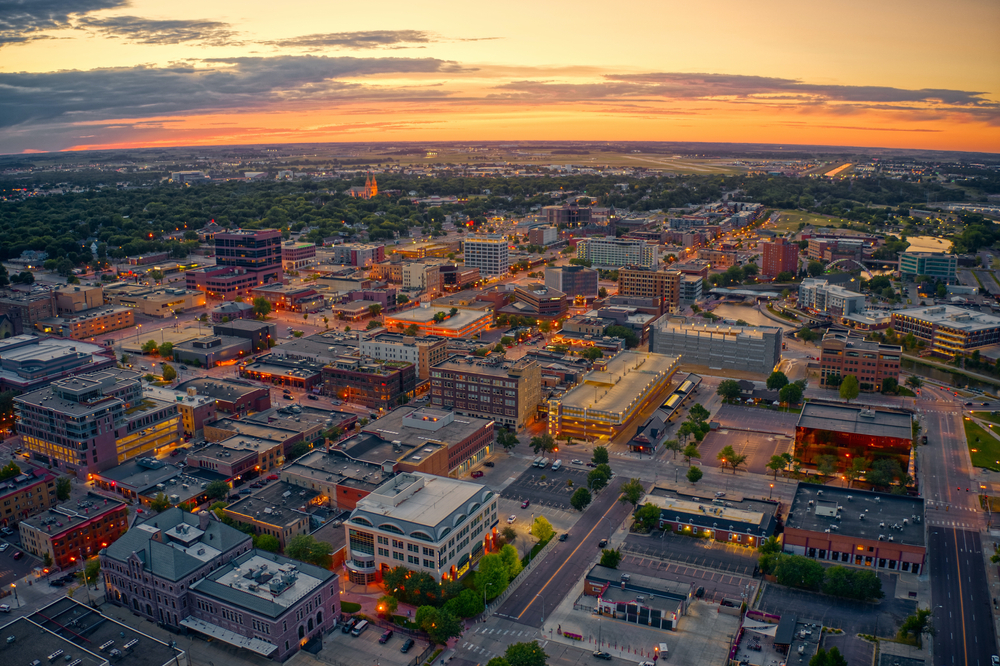
Photo Credit: Jacob Boomsma / Shutterstock
10. South Dakota
- Percentage change in used car spending (2019-2020): +17.2%
- Total change in used car spending (2019-2020): +$92,900,000
- Used car spending per capita (2020): $708
- Used car spending per capita (2019): $609

Photo Credit: Sean Pavone / Shutterstock
9. Maine
- Percentage change in used car spending (2019-2020): +17.5%
- Total change in used car spending (2019-2020): +$127,200,000
- Used car spending per capita (2020): $633
- Used car spending per capita (2019): $541

Photo Credit: Jacob Boomsma / Shutterstock
8. Wyoming
- Percentage change in used car spending (2019-2020): +18.3%
- Total change in used car spending (2019-2020): +$60,000,000
- Used car spending per capita (2020): $665
- Used car spending per capita (2019): $565

Photo Credit: DomVisuals / Shutterstock
7. Nebraska
- Percentage change in used car spending (2019-2020): +18.4%
- Total change in used car spending (2019-2020): +$254,600,000
- Used car spending per capita (2020): $847
- Used car spending per capita (2019): $717
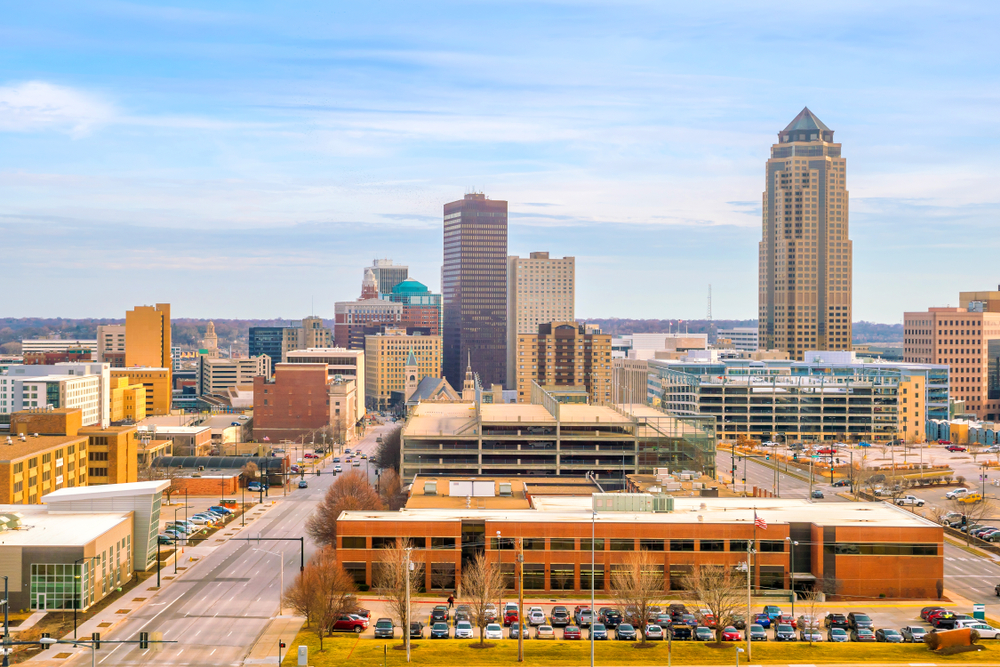
Photo Credit: f11photo / Shutterstock
6. Iowa
- Percentage change in used car spending (2019-2020): +18.8%
- Total change in used car spending (2019-2020): +$445,600,000
- Used car spending per capita (2020): $892
- Used car spending per capita (2019): $753
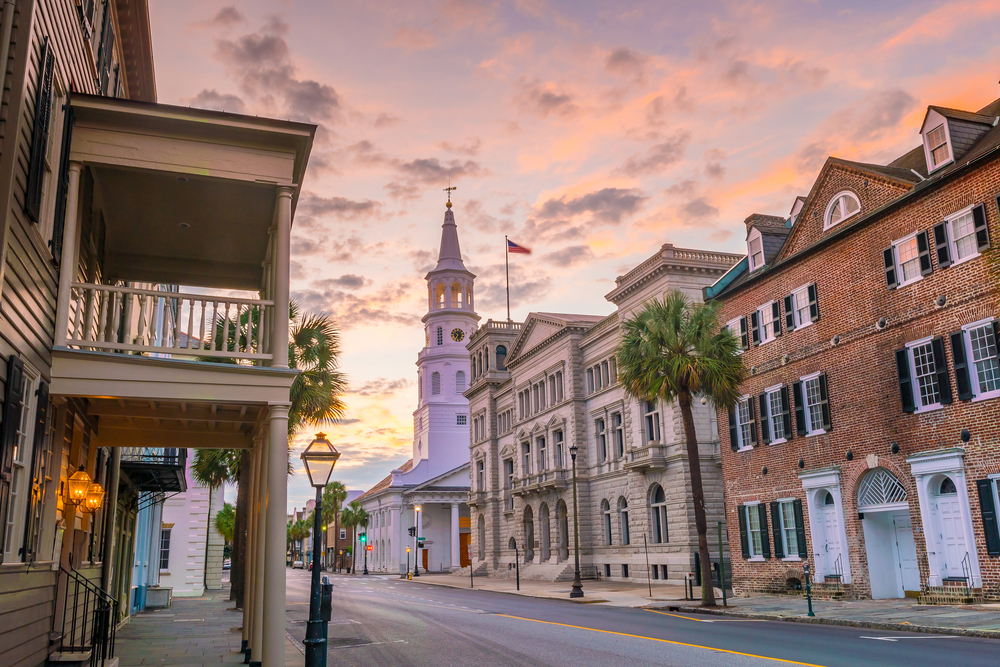
Photo Credit: f11photo / Shutterstock
5. South Carolina
- Percentage change in used car spending (2019-2020): +19.1%
- Total change in used car spending (2019-2020): +$476,200,000
- Used car spending per capita (2020): $569
- Used car spending per capita (2019): $485
TRENDING
CoPilot helps you navigate every step of the car-purchasing journey. Download the CoPilot app today, and shop for your next car with confidence.
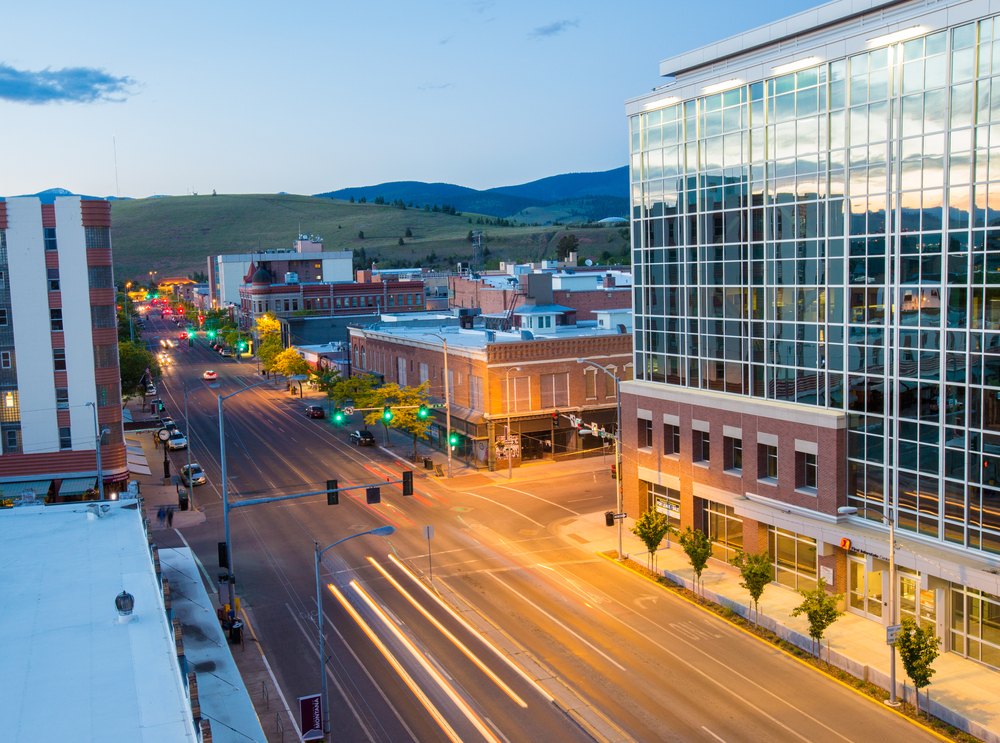
Photo Credit: Mary Vanier / Shutterstock
4. Montana
- Percentage change in used car spending (2019-2020): +19.3%
- Total change in used car spending (2019-2020): +$140,100,000
- Used car spending per capita (2020): $803
- Used car spending per capita (2019): $681
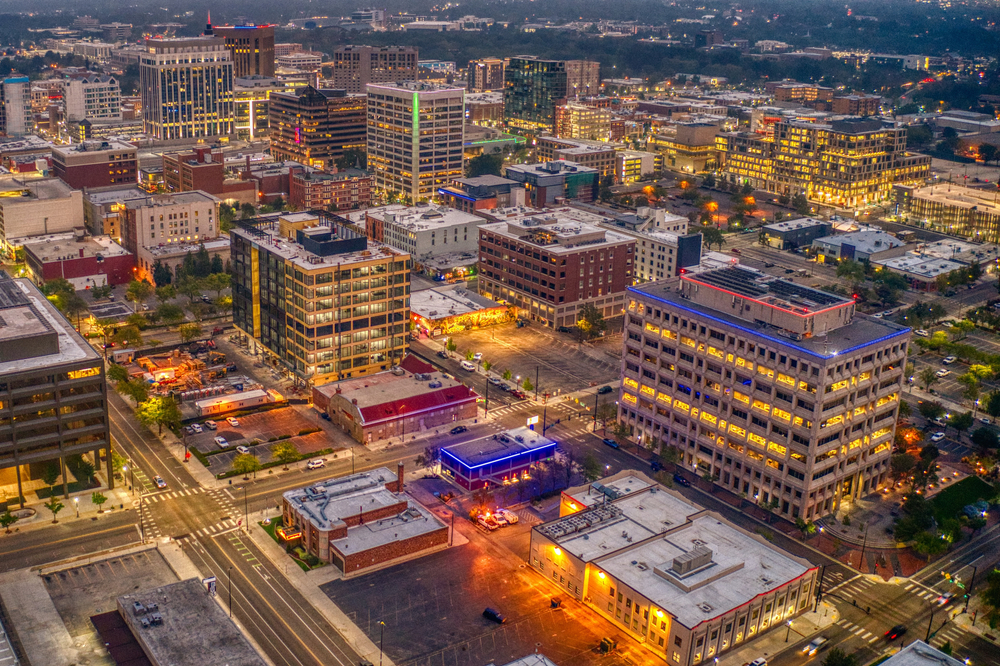
Photo Credit: Jacob Boomsma / Shutterstock
3. Idaho
- Percentage change in used car spending (2019-2020): +19.6%
- Total change in used car spending (2019-2020): +$161,300,000
- Used car spending per capita (2020): $540
- Used car spending per capita (2019): $462
Photo Credit: Sean Pavone / Shutterstock
2. Utah
- Percentage change in used car spending (2019-2020): +20.6%
- Total change in used car spending (2019-2020): +$408,400,000
- Used car spending per capita (2020): $735
- Used car spending per capita (2019): $618

Photo Credit: Mark Skalny / Shutterstock
1. Arizona
- Percentage change in used car spending (2019-2020): +22.0%
- Total change in used car spending (2019-2020): +$719,200,000
- Used car spending per capita (2020): $537
- Used car spending per capita (2019): $448
Detailed Findings & Methodology
The data used in this analysis is from the U.S. Bureau of Economic Analysis’s Personal Consumption Expenditures. To determine the states with the biggest increase in used vehicle purchases during COVID-19, researchers calculated the percentage change in total used car spending between 2019 and 2020. In the event of a tie, the state with the greater total change in used car spending over the same time period was ranked higher.
https://infogram.com/1plrevgy5290e6fqrdgdm11w67izvzer7yk?live